Stromfee
Power Play: A 48-Hour Energy Snapshot of Our Tech Workspace
18. März 2025
Stromfee
Power Dynamics: A Comprehensive Analysis of Office Energy Consumption Trends
18. März 2025
Stromfee
Power Play: Illuminating Our 48-Hour Workstation Energy Challenge
18. März 2025
Stromfee
Powering Progress: A Day in the Life of Workplace Energy Dynamics
18. März 2025
Stromfee
Powering Up: A Comprehensive Guide to Workstation Energy Dynamics
18. März 2025
Stromfee
Powering Performance: A Deep Dive into Office Energy Consumption
17. März 2025
Stromfee
**Powering Productivity: A Watt-by-Watt Journey Through Our Tech Workspace**
17. März 2025
Stromfee
Energy Insights: A Detailed Look at Our Office's Power Consumption Patterns
17. März 2025
Stromfee
Powering Through: A Dynamic Snapshot of Workstation Energy Trends
17. März 2025
Stromfee
Energy Dynamics Unveiled: A Deep Dive into Workstation Power Consumption
17. März 2025
Stromfee
Power Play: A Detailed Look at Our Office Workstation Energy Dynamics
17. März 2025
Stromfee
**Dive Into Our Office's Energy Vibe: A Cool Energy Checkup!**
17. März 2025
Stromfee
Power Play: A Watt-by-Watt Journey Through Our Office Workstations
16. März 2025
Stromfee
Power Dynamics Decoded: A Comprehensive Energy Consumption Analysis of Our Workplace Workstations
16. März 2025
Stromfee
Temperaturmanagement im Eigenheim: Effizientes Heizen und Warmwasserbereitung - Ein Praxisbericht
15. März 2025
Stromfee
Temperatur-Check: Wie wir unser Zuhause gemütlich und energieeffizient gestalten
15. März 2025
Stromfee
Temperaturanalyse: Heizsysteme und Wohnkomfort in Bünde optimieren
14. März 2025
Stromfee
Heizung und Wetter – Eine aufschlussreiche Analyse aus Bünde
14. März 2025
Stromfee
Temperaturverläufe im Haus: Ein spannender Einblick in unsere Wohlfühl-Wärme
13. März 2025
Stromfee
Die "neue Normalität" der Energiepreise – Und wie Sie sie zu Ihrem Vorteil nutzen
12. Nov. 2025
Stromfee
Strommarkt vor einem Paradigmenwechsel: Statt Stundenpreisen gibt es künftig 96 Preissignale am Tag
2. Nov. 2025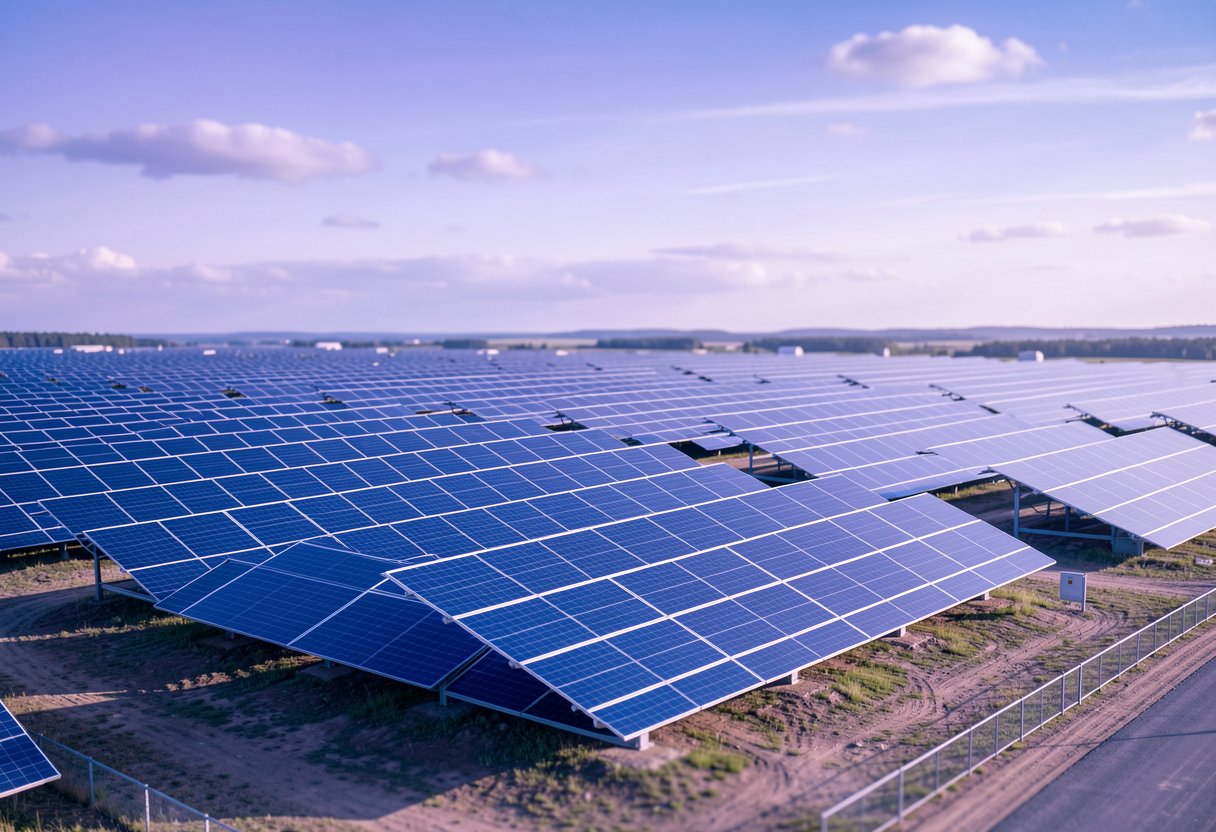
Stromfee
Solarpower im Detail: Die beeindruckenden Leistungsdaten unserer 664-kW-Photovoltaikanlage
5. Aug. 2025
Stromfee
Energieanalyse: Leistungsbilanz unserer 1000-kWp-Photovoltaikanlage
4. Aug. 2025
Stromfee