
stromfee.ai@gmail.com
- Germany , West Europa
- July 11, 2025
- 0 views
# Energieschau unter der Lupe: Unsere PV-Anlage bringt’s!
Views: 0**Titel: Energieschau unter der Lupe: Unsere PV-Anlage bringt’s!** Hallo liebe Energie-Fans, heute werfen wir einen spannenden Blick auf unsere 1000 kWp PV-Anlage und teilen einige prickelnde Details über ihre Performance. Bereit für eine kleine Tour? Los geht’s! 🌞 **1. Aktuelle Power unter der Sonne** Unser Solarjuwel hat kürzlich stolze 664 kW gekitzelt, während sie momentan gemütliche 517 kW schnurrt. Ziemlich cool, oder? Das zeigt uns, dass sie fast am Limit schnurrt, auch wenn das Sonnenkino nicht immer Vollgas gibt. Ein echter Sonnenkämpfer! ☀️💪 **2. Stabiler Puls im Netz** Mit einer Netzspannung, die stabil bei rund 240 V liegt, zeigt unsere Anlage, wie gut sie sich ins große Stromnetz einfügt. Selbst die kleinen Tanzeinlagen zwischen 236 V und 238 V sind kein Grund zur Sorge – unsere Anlage bleibt zuverlässig. 🏋️♂️ **3. Perfekte Performance mit Cosphi** Ein Cosphi-Wert von 1 ist wie eine Punktlandung in der Gymnastik – einfach perfekt! Das bedeutet, dass unsere Anlage ihre Energie super effizient nutzt. Keine unnötigen Verluste hier! 🌟 **4. Blindleistung? Kein Thema!** Schwankende Blindleistungswerte? Kein Problem für uns. Unsere Anlage zeigt, wie sie flexibel bleibt und selbst bei veränderlichen Anforderungen top Leistung bringt. Dadurch bleibt die Effizienz immer im grünen Bereich. 📉➡️📈 **5. Starke Ströme, starke Anlage** Unsere Leitströme zeigen Werte von 768 A bis 771 A – das ist echte Stabilität! Das bedeutet, dass unsere Anlage verlässlich und kraftvoll arbeitet und sich von nichts aus der Ruhe bringen lässt. ⚡ **Fazit: Sonnenkraft, die begeistert** Zusammenfassend zeigt unsere liebe Anlage, dass sie ein echter Sonnenheld ist. Trotz ein paar normalen Schwankungen in der Leistung, der Blindleistung und der Spannung, die Ergebnisse sind durchwegs positiv. Regelmäßige Checks helfen uns, alles optimal am Laufen zu halten und sicherzustellen, dass unsere Anlage immer ihr Bestes gibt. Bis zum nächsten Energie-Update, bleibt sonnig! #PVAnlage #EnergieEffizienz #Solarenergie #ErneuerbareEnergie #Stromnetz #TechnikBegeisterthttp://www.stromfee.graphics/images_sshot/leonardo_image_20250711_110225_1.png
Read more
- Germany , West Europa
- July 10, 2025
- 0 views
# Wie toll unsere PV-Anlage läuft – Ein sonniger Überblick! ☀️
Views: 0**Titel: Wie toll unsere PV-Anlage läuft – Ein sonniger Überblick! ☀️** **1. Super Leistung!** Unsere Photovoltaikanlage ballert richtig! Mit einer maximalen Kapazität von 664 kW bringen wir es momentan auf stolze 517 kW. Das ist fast das Maximum! Solche Zahlen sehen wir natürlich gerne, denn sie bedeuten: Viel Sonne, super Wetter und grüne Energie für alle! **2. Alles im grünen Bereich!** Unsere Netzspannung hält, was sie verspricht: Ein konstant starkes Level mit 238 V aktuell und einem Durchschnitt von 236 V. Das zeigt, wie stabil unsere Anlage läuft. Kleine Schwankungen gehören dazu, aber die fangen wir locker auf. So bleibt alles sicher und zuverlässig. **3. Perfekte Werte – Cosphi rockt!** Wusstet Ihr, dass alle unsere Cosphi-Werte bei 1 liegen? Das ist wie eine perfekte 10 beim Eiskunstlauf! Diese Top-Werte geben uns die Sicherheit, dass unsere Anlage super effizient arbeitet und keine Energie verschwendet wird. **4. Auf die Blindleistung achten!** Okay, bei der Blindleistung gibt es ein bisschen Auf und Ab (zwischen -588 VAr und 1.32 kVar), gerade sind wir bei -2.24 kVar. Klingt technisch, bedeutet aber, dass wir auch hier am Ball bleiben müssen, um alles optimal zu managen. **5. Die Stromstärke zeigt’s!** Mit einer aktuellen Stromstärke von 768 A und kleinen Schwankungen sehen wir, wie lebendig das Ganze ist. Diese kleinen Variationen im Strom geben uns Hinweise, wo wir vielleicht noch optimieren können. **Zusammengefasst: Unsere PV-Anlage macht uns fast so stolz wie frisch gebackene Kuchenkrümel!** Sie arbeitet effektiv, fast auf Maximalleistung und ist ein echtes Öko-Kraftpaket. Solch positive Trends sind ein Grund zum Feiern. Aber keine Sorge, wir halten die Augen offen und optimieren, wo es geht, um immer grün und effizient zu bleiben! #Energie #Ökostrom #Nachhaltigkeit #SonnigeZeiten Macht weiter so! Ihr seid super und zusammen rocken wir das – auf eine grünere Zukunft! 🌍💪http://www.stromfee.graphics/images_sshot/leonardo_image_20250710_110219_1.png
Read more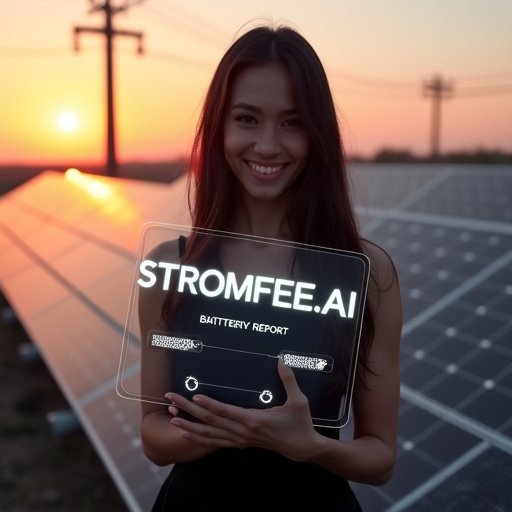
- Germany , West Europa
- July 9, 2025
- 0 views
# Unsere PV-Anlage im Check: Leistungsdaten & Optimierungspotenziale
Views: 0**Titel: Unsere PV-Anlage im Check! 🌞** Hallo liebe Community! Heute werfen wir einen spannenden Blick auf unsere PV-Anlage und teilen einige interessante Einblicke mit euch! #Energie #Nachhaltigkeit **1. Super Leistung! 💪** Unsere Anlage hat eine Maximalleistung von starken 664 kW erreicht, aktuell nutzen wir 517 kW. Das ist ziemlich beeindruckend, oder? Es zeigt, wie gut unsere Anlage auch unter verschiedenen Bedingungen funktioniert. 🌱 #Solarenergie **2. Stabile Netzspannung 🚀** Die Netzspannung hält sich stabil bei Werten um 238 V. Das bedeutet, alles läuft rund und wir haben eine zuverlässige Energieversorgung – ohne große Schwankungen oder Ausfälle. Super, nicht wahr? #Sicherheit **3. Perfekter Cosφ-Wert!** Mit einem Cosφ von 1 hat unsere Anlage die ideale Auslastung – das steht für effiziente Energieübertragung. Das bedeutet weniger Energieverlust und mehr Leistung direkt dorthin, wo sie gebraucht wird! #Effizienz **4. Blindleistung – Optimierungspotenzial 🔄** Die Blindleistung zeigt Werte zwischen -2.24 kVar und 1.32 kVar. Hier sehen wir noch etwas Spielraum für Optimierungen, um unsere Anlage noch effektiver zu machen! #Optimierung **5. Kräftiger Leistungsstrom ⚡** Mit starken 768 A zeigt unsere Anlage, dass sie auch bei hohem Bedarf zuverlässig Strom liefert. Das hilft uns, den täglichen Energiebedarf optimal zu decken und zu planen. #Zuverlässigkeit **Zusammenfassung 💡** Insgesamt zeigt unsere PV-Anlage tolle Leistungen und eine stabile Energieversorgung. Trotzdem sehen wir, dass es immer Raum für kleine Verbesserungen gibt, um noch besser zu werden. Lasst uns zusammen weiter daran arbeiten, unsere Energie smart und nachhaltig zu nutzen. 🌍 #NachhaltigeEnergie Danke, dass ihr dabei seid und lasst uns gemeinsam diesen Weg zu einer nachhaltigeren Zukunft weitergehen! Bis bald, Euer [Dein Name] #EnergieAnalyse #Photovoltaik #GrüneEnergiehttp://www.stromfee.graphics/images_sshot/leonardo_image_20250709_110222_1.png
Read more
- Germany , West Europa
- July 8, 2025
- 0 views
# Sonnige Aussichten: Ein tiefer Tauchgang in die Welt unserer Photovoltaikanlage!
Views: 0**”Sonnige Aussichten: Ein tiefer Tauchgang in die Welt unserer Photovoltaikanlage!”** Hallo ihr Sonnenanbeter und Energie-Enthusiasten! ☀️🌱 Heute werfen wir einen Blick auf die aufregenden Daten unserer beeindruckenden 1000 kWp PV-Anlage. Schnallt euch an, es wird elektrisierend! **1. Powerplay unserer Anlage:** Ganz schön sun-sational, oder? Unsere PV-Anlage hat eine beeindruckende Spitzenleistung von 664 kW erreicht! Momentan läuft sie mit 517 kW. Diese kleine Differenz zeigt uns, dass manchmal Wolken am Himmel sind – aber keine Sorge, das ist ganz normal und wir bleiben dran, die Sonne maximal zu nutzen. 🌤️⚡️ **2. Immer gut unter Strom – Die Netzspannung:** Unsere Netzspannung hält sich brav zwischen 236 V und 240 V – alles im grünen Bereich! Dieser stabile Wert sorgt dafür, dass wir effizient und zuverlässig Energie ins Netz speisen können. Ein echter Balanceakt! 🌍🔋 **3. CosPhi – Der Perfektionist unter den Werten:** Perfekt! Unser CosPhi-Wert steht stolz bei 1. Das bedeutet, wir nutzen jeden Funken Strom optimal aus – keine Verschwendung, nur volle Power! 💪🏽💡 **4. Einsparpotenzial bei der Blindleistung:** Ein kleiner Fun Fact am Rande: Unsere Blindleistungs-Werte sind mal drüber, mal drunter – von -588 VAr bis zu -2.24 kVAr. Hier könnten wir noch ein bisschen justieren, um noch effizienter zu werden. An die Arbeit! 👷♂️🛠️ **5. Stromwerte im Fluss:** Unsere Stromwerte tanzen zwischen 761 A und 771 A. Das zeigt, wie lebendig und dynamisch unsere Anlage auf Sonnenschein und Wolken reagiert – ein echter Naturbursche! 🌞🍃 **Zusammengefasst:** Unsere PV-Anlage ist ein echter Champion in Sachen Energie – sie arbeitet zuverlässig und effizient. Trotzdem halten wir die Augen offen für kleine Verbesserungen, denn in der Welt der erneuerbaren Energien gibt es immer was zu tun! Bleibt neugierig und energetisiert – bis zum nächsten Update! Und denkt daran: Jedes Watt zählt! 💚🔌 #Photovoltaik #ErneuerbareEnergie #Energieeffizienz #Solarenergie #Umweltfreundlich Fühlt euch frei, eure Gedanken zu teilen und Fragen zu stellen. Wir sind hier, um zu diskutieren und zu lernen. 🤓💬http://www.stromfee.graphics/images_sshot/leonardo_image_20250708_110229_1.png
Read more
- Germany , West Europa
- July 7, 2025
- 0 views
# Leistungsanalyse und Effizienzbetrachtung unserer 1000 kWp Photovoltaikanlage
Views: 4**Energieanalyse: Ein tiefgehender Blick auf unsere PV-Anlage 🌞** **1. Wie schlägt sich unsere 1000 kWp PV-Anlage?** Unsere Anlage hat wirklich Power! Mit einer Spitzenleistung von 664 kW kratzen wir schon fast am Maximum. Aktuell sind wir bei starken 517 kW. Am meisten tut sich zur Mittagszeit – Sonnenpower pur! 🌞🔋 **2. Netzspannung – alles im grünen Bereich?** Ja, sieht super aus! Unsere Spannung pendelt leicht zwischen 238 V und dem Hoch von 240 V, bleibt aber immer schön stabil. Das bedeutet, dass wir uns auf eine zuverlässige Energieversorgung verlassen können. 📈 **3. Cosϕ (Leistungsfaktor) – Optimale Effizienz?** Absolut! Unser Cosϕ steht durchgehend bei 1 – das heißt, wir nutzen die Energie ohne Verluste. So effizient kann Stromfluss sein! ⚡️ **4. Blindleistung – was sagen die Zahlen?** Hier sind wir richtig aktiv! Unsere Werte liegen zwischen -588 VAr und 1.32 kVar. Durch cleveres Management der Blindleistung boosten wir unsere Effizienz. 🔄 **5. Wie sieht’s mit dem Lieferstrom aus?** Aktuell fließen starke 768 A durch unsere Leitungen, mit leichten Schwankungen. Besonders toll: Die hohen Stromwerte bei Tageslicht unterstreichen, wie leistungsstark unsere Anlage ist. 💪 **Fazit** Die Analyse spricht Klartext: Unsere PV-Anlage arbeitet auf Hochtouren! Die stabile Netzspannung und der optimale Cosϕ sorgen für eine top Energieübertragung, und durch das aktive Management der Blindleistung bleiben wir effizient. Um das auch weiterhin zu garantieren, halten wir immer ein Auge auf alles – Sicher ist sicher! ✅ #GrüneEnergie #Nachhaltigkeit #PVAnlage #EnergieEffizienz #SolarPowerhttp://www.stromfee.graphics/images_sshot/leonardo_image_20250707_110237_1.png
Read more
- Germany , West Europa
- July 6, 2025
- 0 views
# Sonnenkraft im Detail: Unsere PV-Anlage unter der Lupe
Views: 0🌞 Hallo liebe Solarfreunde! Heute tauchen wir mal in die spannende Welt der Photovoltaikanlagen ein. Wir werfen einen Blick auf die verschiedenen Aspekte einer PV-Anlage und was das für uns bedeutet. Lasst uns zusammen herausfinden, wie wir unsere Solarenergie optimal nutzen können! #EnergieWende #SolarPower 1️⃣ **Leistungsentwicklung**: Unsere PV-Anlage hat eine Maximalleistung von stolzen 664 kW, arbeitet aktuell aber mit 517 kW. Diese Schwankungen sind ganz normal und hängen oft vom Wetter oder der Tageszeit ab. Besonders mittags gibt’s einen tollen Leistungsschub – das zeigt uns das bunte Diagramm ganz klar! 2️⃣ **Netzspannung**: Spannung ist im wahrsten Sinne des Wortes in der Luft! Von 240 V geht es leicht runter auf 238 V, mit einem Durchschnitt von 236 V. Die gute Nachricht? Die Spannung bleibt schön stabil, was super wichtig für die Energieübertragung ist. Keine Sorgen, alles läuft rund! #Stromstabil 3️⃣ **Cosphi – Der Leistungsfaktor**: Hier können wir stolz sein, Freunde! Unser Cosphi-Wert liegt durchgängig bei 1. Das bedeutet, dass wir unsere Energie super effizient nutzen und kaum etwas verschwenden. Top Leistung, ihr Lieben! #EnergieEffizient 4️⃣ **Blindleistung**: Hier sehen wir ein bisschen Auf und Ab. Die Werte schwanken, und das zeigt, dass wir vielleicht noch ein wenig an der Optimierung der Anlagenkomponenten arbeiten müssen. Aber keine Panik, das kriegen wir hin! #Optimierung 5️⃣ **Leistungsstrom**: Bei Werten von 768 A, 761 A und 771 A sehen wir eine schöne Konstanz. Das bedeutet, dass unser System gut ausbalanciert ist und alles gleichmäßig läuft. Ein Hoch auf unsere zuverlässige Anlage! #StromStark 🔍 **Zusammenfassung**: Alles in allem läuft unsere Anlage stabil und zuverlässig. Ein paar kleine Optimierungen hier und da könnten uns noch effizienter machen, aber wir sind auf einem super Weg. Lasst uns gemeinsam auf eine sonnige Zukunft setzen! #SonnenPower Freut euch auf weitere Updates und lasst uns gemeinsam den Weg zu einer nachhaltigeren Zukunft beschreiten. Sonnige Grüße! ☀️👋http://www.stromfee.graphics/images_sshot/leonardo_image_20250706_110238_1.png
Read more
- Germany , West Europa
- July 6, 2025
- 0 views
# Solarkraft in Höchstform: Leistungsanalyse unserer 1000 kWp Photovoltaikanlage
Views: 0**Energieanalyse: Alles über die Power unserer 1000 kWp PV-Anlage! 🌞** Hey, liebe Energie-Fans! Gestern habe ich mir unsere Photovoltaikanlage genauer angeschaut und was soll ich sagen – sie läuft fast am Limit ihrer Kapazität! Mit einer beeindruckenden Leistung von 553 kW, knapp unter ihrer maximalen Power von 664 kW, zeigt sie, was sie kann! Natürlich gibt es hier und da ein paar Schwankungen, die wahrscheinlich auf die wechselnde Sonneneinstrahlung oder kleine Schattenzonen zurückzuführen sind – ganz normal also. Jetzt zum Herzschlag der Anlage: die Netzspannung! Sie ist mit Werten um die 237 V absolut stabil und im grünen Bereich. Das spricht für eine zuverlässige PV-Anlage, die auch bei kleinen Spannungsschwankungen cool bleibt. Aber natürlich haben wir das im Blick, falls plötzliche Sprünge auftreten sollten. Und jetzt: Trommelwirbel für unsere Cosphi-Werte – allesamt perfekte Einsen! Das bedeutet, unsere Anlage wandelt die Energie wie ein Profi um und füttert unser Netz optimal. So eine top Performance erleichtert wirklich das Energiehüter-Herz. Aber, jede Medaille hat ihre zwei Seiten: Die Blindleistung zeigt ein bisschen Auf und Ab. Wir halten das natürlich genau im Auge, denn niemand mag unerwartete Kosten, richtig? Zuletzt, unsere Leitungsströme: Stabil zwischen 977 A und 981 A. Das bedeutet, dass unsere Leitungen under control sind und keine Sorge vor Überlastung besteht. Also, ihr Lieben, das war’s! Ich denk, unsere Anlage macht ihre Sache super, und wir arbeiten hart daran, dass das auch so bleibt. Habt ihr Fragen zu unserer Solarpower oder wollt mehr erfahren? Lasst uns reden! 🌟 #SolarPower #EnergieWende #Nachhaltigkeit #GrüneEnergiehttp://www.stromfee.graphics/images_sshot/leonardo_image_20250706_104731_1.png
Read more
- Germany , West Europa
- July 6, 2025
- 0 views
# Germany’s Energy Landscape: Navigating Wind, Solar, and Market Dynamics
Views: 2Hey there, energy enthusiasts! 🌞💨 Have you ever wondered how the energy landscape unfolds in Germany? Let’s dive into the latest charts and see what they reveal about energy trends in this powerhouse of efficiency! 🔍 **1. Spot Price Analysis** Did you know that the cost of electricity fluctuates throughout the day? It’s fascinating! In Germany, during busy hours when everyone’s using power, prices go up. But check this out – there are surprises on some days when prices just plummet. Could it be a sunny day with lots of solar energy pouring in? It’s all about timing and tapping into the best rates. 🌬️ **2. Wind Power Production Forecast** March 30th was quite a day for wind energy in Germany, showing a spike in production. Isn’t it amazing how the forecast and actual figures line up closely? It’s like having a weather-savvy crystal ball! But, oh! There was a slight dip after that. Maybe the wind decided to take a quick nap? ☀️ **3. Solar Photovoltaic Production Forecast** Here comes the sun! And with it, power peaks right around lunchtime. It’s a daily solar party! However, clouds can be party poopers, affecting how much energy we get. It’s a reminder of how sunny days can be power boosters for our solar grids! 🌡️ **4. Temperature Trends** As we stroll into warmer days, did you know that rising temperatures could mean more air conditioning and higher energy needs? It’s a seasonal dance of demand and supply! **Conclusion** So, what have we learned from peeking into these charts? Whether it’s wind, solar, or our daily routines, everything’s connected. Germany’s focus on renewable energy is more than just an eco-friendly choice; it’s about smart, adaptable strategies to keep the energy flowing efficiently. Let’s stay plugged into this fascinating world of energy trends! Thank you for tuning in! Don’t forget to share your thoughts or tag someone who’d love this sneak peek into Germany’s energy trends! #EnergyTrends #RenewableEnergy #SmartLiving #GermanyEnergy Happy energizing! 💡🌍http://www.stromfee.graphics/images_sshot/leonardo_image_20250329_061302_1.png
Read more- AI Cooling , AI Heating , USA
- May 29, 2025
- 0 views
Harrisburg’s Data Dive: Unraveling Our Local Environmental Patterns
Views: 1🌟 Hey Harrisburg friends! Let’s dive into our local environment through the lens of data with some fun insights! 🎯 1️⃣ **Power Consumption Analysis** Ever wonder how much energy we’re using? Well, it turns out our power usage is pretty steady at 20 mW—no big spikes or drops! It’s like our city is on cruise control, which could be great for planning our energy needs but might also mean we’re missing some details. Let’s keep an eye on this to boost our energy efficiency game! 💡 2️⃣ **Temperature Variation** Guess what? Our temperatures in Harrisburg have been playing it cool with no wild swings. While it’s nice to have that predictability, it’s a bit like a movie with no plot twists. We might be missing out on some key changes, so staying updated could help us understand our climate better! 🌡️ 3️⃣ **Humidity Levels** Moving on to humidity, or rather, the mystery of it—our charts are a tad empty. Without these ups and downs, it’s hard to connect the dots between our warm days and muggy nights. More data could really tell us more about our weather patterns! ☁️ 4️⃣ **Cloudiness Metrics** And on the topic of looking up—our cloudiness is consistently… consistent! While it’s easy weather for sunbathing, this unchanging sky scene means we might overlook how clouds affect our temperatures and sunshine levels. More cloud chats needed! ☀️🌤️ 5️⃣ **Power Usage by Devices** Last but not least, let’s talk about our binge-watching habits with the family TV. We’ve noticed some peaks in power use, probably during those season finale marathons! This tells us a lot about when we’re most likely to hit the power button. Understanding this could help us manage our electricity better—maybe even save some cash! 📺💸 🔍 **Conclusion** All this data gives us a mixed bag—some steady stats and some intriguing spikes. It’s clear we need to keep gathering info to make sure Harrisburg not only stays beautiful but also becomes more sustainable and efficient. Together, let’s keep our community informed and engaged in making smarter, greener choices! 🌿🌍 #Harrisburg #Environment #DataInsights #Sustainability #CommunityEngagementhttp://www.stromfee.graphics/images_sshot/leonardo_image_20250525_144219_1.png
Read more- AI Cooling , AI Heating , USA
- May 29, 2025
- 0 views
Harrisburg’s Environmental Pulse: A Data-Driven Community Snapshot
Views: 0🌟 Hey Harrisburg friends! Let’s dive into our local environment through the lens of data with some fun insights! 🎯 1️⃣ **Power Consumption Analysis** Ever wonder how much energy we’re using? Well, it turns out our power usage is pretty steady at 20 mW—no big spikes or drops! It’s like our city is on cruise control, which could be great for planning our energy needs but might also mean we’re missing some details. Let’s keep an eye on this to boost our energy efficiency game! 💡 2️⃣ **Temperature Variation** Guess what? Our temperatures in Harrisburg have been playing it cool with no wild swings. While it’s nice to have that predictability, it’s a bit like a movie with no plot twists. We might be missing out on some key changes, so staying updated could help us understand our climate better! 🌡️ 3️⃣ **Humidity Levels** Moving on to humidity, or rather, the mystery of it—our charts are a tad empty. Without these ups and downs, it’s hard to connect the dots between our warm days and muggy nights. More data could really tell us more about our weather patterns! ☁️ 4️⃣ **Cloudiness Metrics** And on the topic of looking up—our cloudiness is consistently… consistent! While it’s easy weather for sunbathing, this unchanging sky scene means we might overlook how clouds affect our temperatures and sunshine levels. More cloud chats needed! ☀️🌤️ 5️⃣ **Power Usage by Devices** Last but not least, let’s talk about our binge-watching habits with the family TV. We’ve noticed some peaks in power use, probably during those season finale marathons! This tells us a lot about when we’re most likely to hit the power button. Understanding this could help us manage our electricity better—maybe even save some cash! 📺💸 🔍 **Conclusion** All this data gives us a mixed bag—some steady stats and some intriguing spikes. It’s clear we need to keep gathering info to make sure Harrisburg not only stays beautiful but also becomes more sustainable and efficient. Together, let’s keep our community informed and engaged in making smarter, greener choices! 🌿🌍 #Harrisburg #Environment #DataInsights #Sustainability #CommunityEngagementhttp://www.stromfee.graphics/images_sshot/leonardo_image_20250525_144219_1.png
Read more- AI Cooling , AI Heating , USA
- May 29, 2025
- 0 views
Harrisburg’s Environmental Data: A Community Insight Journey
Views: 0🌟 Hey Harrisburg friends! Let’s dive into our local environment through the lens of data with some fun insights! 🎯 1️⃣ **Power Consumption Analysis** Ever wonder how much energy we’re using? Well, it turns out our power usage is pretty steady at 20 mW—no big spikes or drops! It’s like our city is on cruise control, which could be great for planning our energy needs but might also mean we’re missing some details. Let’s keep an eye on this to boost our energy efficiency game! 💡 2️⃣ **Temperature Variation** Guess what? Our temperatures in Harrisburg have been playing it cool with no wild swings. While it’s nice to have that predictability, it’s a bit like a movie with no plot twists. We might be missing out on some key changes, so staying updated could help us understand our climate better! 🌡️ 3️⃣ **Humidity Levels** Moving on to humidity, or rather, the mystery of it—our charts are a tad empty. Without these ups and downs, it’s hard to connect the dots between our warm days and muggy nights. More data could really tell us more about our weather patterns! ☁️ 4️⃣ **Cloudiness Metrics** And on the topic of looking up—our cloudiness is consistently… consistent! While it’s easy weather for sunbathing, this unchanging sky scene means we might overlook how clouds affect our temperatures and sunshine levels. More cloud chats needed! ☀️🌤️ 5️⃣ **Power Usage by Devices** Last but not least, let’s talk about our binge-watching habits with the family TV. We’ve noticed some peaks in power use, probably during those season finale marathons! This tells us a lot about when we’re most likely to hit the power button. Understanding this could help us manage our electricity better—maybe even save some cash! 📺💸 🔍 **Conclusion** All this data gives us a mixed bag—some steady stats and some intriguing spikes. It’s clear we need to keep gathering info to make sure Harrisburg not only stays beautiful but also becomes more sustainable and efficient. Together, let’s keep our community informed and engaged in making smarter, greener choices! 🌿🌍 #Harrisburg #Environment #DataInsights #Sustainability #CommunityEngagementhttp://www.stromfee.graphics/images_sshot/leonardo_image_20250525_144219_1.png
Read more- AI Cooling , AI Heating , USA
- May 29, 2025
- 0 views
Harrisburg’s Environmental Pulse: Decoding Our City’s Data Dynamics
Views: 0🌟 Hey Harrisburg friends! Let’s dive into our local environment through the lens of data with some fun insights! 🎯 1️⃣ **Power Consumption Analysis** Ever wonder how much energy we’re using? Well, it turns out our power usage is pretty steady at 20 mW—no big spikes or drops! It’s like our city is on cruise control, which could be great for planning our energy needs but might also mean we’re missing some details. Let’s keep an eye on this to boost our energy efficiency game! 💡 2️⃣ **Temperature Variation** Guess what? Our temperatures in Harrisburg have been playing it cool with no wild swings. While it’s nice to have that predictability, it’s a bit like a movie with no plot twists. We might be missing out on some key changes, so staying updated could help us understand our climate better! 🌡️ 3️⃣ **Humidity Levels** Moving on to humidity, or rather, the mystery of it—our charts are a tad empty. Without these ups and downs, it’s hard to connect the dots between our warm days and muggy nights. More data could really tell us more about our weather patterns! ☁️ 4️⃣ **Cloudiness Metrics** And on the topic of looking up—our cloudiness is consistently… consistent! While it’s easy weather for sunbathing, this unchanging sky scene means we might overlook how clouds affect our temperatures and sunshine levels. More cloud chats needed! ☀️🌤️ 5️⃣ **Power Usage by Devices** Last but not least, let’s talk about our binge-watching habits with the family TV. We’ve noticed some peaks in power use, probably during those season finale marathons! This tells us a lot about when we’re most likely to hit the power button. Understanding this could help us manage our electricity better—maybe even save some cash! 📺💸 🔍 **Conclusion** All this data gives us a mixed bag—some steady stats and some intriguing spikes. It’s clear we need to keep gathering info to make sure Harrisburg not only stays beautiful but also becomes more sustainable and efficient. Together, let’s keep our community informed and engaged in making smarter, greener choices! 🌿🌍 #Harrisburg #Environment #DataInsights #Sustainability #CommunityEngagementhttp://www.stromfee.graphics/images_sshot/leonardo_image_20250525_144219_1.png
Read more- AI Cooling , AI Heating , USA
- May 29, 2025
- 0 views
Harrisburg’s Data Dive: Unraveling Local Environmental Insights
Views: 0🌟 Hey Harrisburg friends! Let’s dive into our local environment through the lens of data with some fun insights! 🎯 1️⃣ **Power Consumption Analysis** Ever wonder how much energy we’re using? Well, it turns out our power usage is pretty steady at 20 mW—no big spikes or drops! It’s like our city is on cruise control, which could be great for planning our energy needs but might also mean we’re missing some details. Let’s keep an eye on this to boost our energy efficiency game! 💡 2️⃣ **Temperature Variation** Guess what? Our temperatures in Harrisburg have been playing it cool with no wild swings. While it’s nice to have that predictability, it’s a bit like a movie with no plot twists. We might be missing out on some key changes, so staying updated could help us understand our climate better! 🌡️ 3️⃣ **Humidity Levels** Moving on to humidity, or rather, the mystery of it—our charts are a tad empty. Without these ups and downs, it’s hard to connect the dots between our warm days and muggy nights. More data could really tell us more about our weather patterns! ☁️ 4️⃣ **Cloudiness Metrics** And on the topic of looking up—our cloudiness is consistently… consistent! While it’s easy weather for sunbathing, this unchanging sky scene means we might overlook how clouds affect our temperatures and sunshine levels. More cloud chats needed! ☀️🌤️ 5️⃣ **Power Usage by Devices** Last but not least, let’s talk about our binge-watching habits with the family TV. We’ve noticed some peaks in power use, probably during those season finale marathons! This tells us a lot about when we’re most likely to hit the power button. Understanding this could help us manage our electricity better—maybe even save some cash! 📺💸 🔍 **Conclusion** All this data gives us a mixed bag—some steady stats and some intriguing spikes. It’s clear we need to keep gathering info to make sure Harrisburg not only stays beautiful but also becomes more sustainable and efficient. Together, let’s keep our community informed and engaged in making smarter, greener choices! 🌿🌍 #Harrisburg #Environment #DataInsights #Sustainability #CommunityEngagementhttp://www.stromfee.graphics/images_sshot/leonardo_image_20250525_144219_1.png
Read more- AI Cooling , AI Heating , USA
- May 29, 2025
- 0 views
Harrisburg’s Data-Driven Environmental Snapshot: Insights and Opportunities
Views: 0🌟 Hey Harrisburg friends! Let’s dive into our local environment through the lens of data with some fun insights! 🎯 1️⃣ **Power Consumption Analysis** Ever wonder how much energy we’re using? Well, it turns out our power usage is pretty steady at 20 mW—no big spikes or drops! It’s like our city is on cruise control, which could be great for planning our energy needs but might also mean we’re missing some details. Let’s keep an eye on this to boost our energy efficiency game! 💡 2️⃣ **Temperature Variation** Guess what? Our temperatures in Harrisburg have been playing it cool with no wild swings. While it’s nice to have that predictability, it’s a bit like a movie with no plot twists. We might be missing out on some key changes, so staying updated could help us understand our climate better! 🌡️ 3️⃣ **Humidity Levels** Moving on to humidity, or rather, the mystery of it—our charts are a tad empty. Without these ups and downs, it’s hard to connect the dots between our warm days and muggy nights. More data could really tell us more about our weather patterns! ☁️ 4️⃣ **Cloudiness Metrics** And on the topic of looking up—our cloudiness is consistently… consistent! While it’s easy weather for sunbathing, this unchanging sky scene means we might overlook how clouds affect our temperatures and sunshine levels. More cloud chats needed! ☀️🌤️ 5️⃣ **Power Usage by Devices** Last but not least, let’s talk about our binge-watching habits with the family TV. We’ve noticed some peaks in power use, probably during those season finale marathons! This tells us a lot about when we’re most likely to hit the power button. Understanding this could help us manage our electricity better—maybe even save some cash! 📺💸 🔍 **Conclusion** All this data gives us a mixed bag—some steady stats and some intriguing spikes. It’s clear we need to keep gathering info to make sure Harrisburg not only stays beautiful but also becomes more sustainable and efficient. Together, let’s keep our community informed and engaged in making smarter, greener choices! 🌿🌍 #Harrisburg #Environment #DataInsights #Sustainability #CommunityEngagementhttp://www.stromfee.graphics/images_sshot/leonardo_image_20250525_144219_1.png
Read more- AI Cooling , AI Heating , USA
- May 29, 2025
- 0 views
Harrisburg’s Environmental Pulse: A Data-Driven Community Snapshot
Views: 1🌟 Hey Harrisburg friends! Let’s dive into our local environment through the lens of data with some fun insights! 🎯 1️⃣ **Power Consumption Analysis** Ever wonder how much energy we’re using? Well, it turns out our power usage is pretty steady at 20 mW—no big spikes or drops! It’s like our city is on cruise control, which could be great for planning our energy needs but might also mean we’re missing some details. Let’s keep an eye on this to boost our energy efficiency game! 💡 2️⃣ **Temperature Variation** Guess what? Our temperatures in Harrisburg have been playing it cool with no wild swings. While it’s nice to have that predictability, it’s a bit like a movie with no plot twists. We might be missing out on some key changes, so staying updated could help us understand our climate better! 🌡️ 3️⃣ **Humidity Levels** Moving on to humidity, or rather, the mystery of it—our charts are a tad empty. Without these ups and downs, it’s hard to connect the dots between our warm days and muggy nights. More data could really tell us more about our weather patterns! ☁️ 4️⃣ **Cloudiness Metrics** And on the topic of looking up—our cloudiness is consistently… consistent! While it’s easy weather for sunbathing, this unchanging sky scene means we might overlook how clouds affect our temperatures and sunshine levels. More cloud chats needed! ☀️🌤️ 5️⃣ **Power Usage by Devices** Last but not least, let’s talk about our binge-watching habits with the family TV. We’ve noticed some peaks in power use, probably during those season finale marathons! This tells us a lot about when we’re most likely to hit the power button. Understanding this could help us manage our electricity better—maybe even save some cash! 📺💸 🔍 **Conclusion** All this data gives us a mixed bag—some steady stats and some intriguing spikes. It’s clear we need to keep gathering info to make sure Harrisburg not only stays beautiful but also becomes more sustainable and efficient. Together, let’s keep our community informed and engaged in making smarter, greener choices! 🌿🌍 #Harrisburg #Environment #DataInsights #Sustainability #CommunityEngagementhttp://www.stromfee.graphics/images_sshot/leonardo_image_20250525_144219_1.png
Read more- AI Cooling , AI Heating , USA
- May 29, 2025
- 0 views
Harrisburg’s Environmental Pulse: A Data-Driven Community Snapshot
Views: 1🌟 Hey Harrisburg friends! Let’s dive into our local environment through the lens of data with some fun insights! 🎯 1️⃣ **Power Consumption Analysis** Ever wonder how much energy we’re using? Well, it turns out our power usage is pretty steady at 20 mW—no big spikes or drops! It’s like our city is on cruise control, which could be great for planning our energy needs but might also mean we’re missing some details. Let’s keep an eye on this to boost our energy efficiency game! 💡 2️⃣ **Temperature Variation** Guess what? Our temperatures in Harrisburg have been playing it cool with no wild swings. While it’s nice to have that predictability, it’s a bit like a movie with no plot twists. We might be missing out on some key changes, so staying updated could help us understand our climate better! 🌡️ 3️⃣ **Humidity Levels** Moving on to humidity, or rather, the mystery of it—our charts are a tad empty. Without these ups and downs, it’s hard to connect the dots between our warm days and muggy nights. More data could really tell us more about our weather patterns! ☁️ 4️⃣ **Cloudiness Metrics** And on the topic of looking up—our cloudiness is consistently… consistent! While it’s easy weather for sunbathing, this unchanging sky scene means we might overlook how clouds affect our temperatures and sunshine levels. More cloud chats needed! ☀️🌤️ 5️⃣ **Power Usage by Devices** Last but not least, let’s talk about our binge-watching habits with the family TV. We’ve noticed some peaks in power use, probably during those season finale marathons! This tells us a lot about when we’re most likely to hit the power button. Understanding this could help us manage our electricity better—maybe even save some cash! 📺💸 🔍 **Conclusion** All this data gives us a mixed bag—some steady stats and some intriguing spikes. It’s clear we need to keep gathering info to make sure Harrisburg not only stays beautiful but also becomes more sustainable and efficient. Together, let’s keep our community informed and engaged in making smarter, greener choices! 🌿🌍 #Harrisburg #Environment #DataInsights #Sustainability #CommunityEngagementhttp://www.stromfee.graphics/images_sshot/leonardo_image_20250525_144219_1.png
Read more
- AI Cooling , AI Heating , USA
- May 28, 2025
- 0 views
Energy Insights Unveiled: A Data-Driven Journey Through Power, Temperature, and Consumption Trends
Views: 1Hey, energy enthusiasts! 🌟 Today, we’re diving into some cool data insights that can sprinkle magic on our understanding of energy consumption trends, anomalies, and much more. Let’s get started! 🔋 **1. Power Output Analysis** Ever wonder how steady your energy consumption is? The first chart we have shows a solid power output of 20 mW. This nugget offers a peek into a world of stable energy use, free from crazy jumps or dips. It’s our golden baseline to understand how energy efficiency shapes up over time, especially with any sudden changes in our usage habits. 🌡️ **2. Temperature Trends in Harrisburg** Next up, we’re taking a tour through the temperature landscape of Harrisburg. While the specifics aren’t on the table today, the chart keeps it cool with a consistent temperature flow. Staying on top of this with regular checks helps us catch any unexpected heat waves or chilly spells, making sense of how our energy interacts with ever-changing climates. 💧 **3. Humidity Patterns** Now, let’s talk about humidity, or the lack thereof in our data. Yes, our chart seems a bit thirsty for information, spotting a “No data” status. This gap might be a hiccup, but it’s also a stark reminder of how vital keeping track of humidity is for optimizing our heating and cooling, and overall comfort! ☁️ **4. Cloudiness Observation** Speaking of gaps, our cloudiness insight also walks into the room with not much to offer, thanks to missing data points. Since clouds play a big game in controlling temperature and humidity, it’s essential we get this data back on track for clearer insights into how they dance with our energy use. 📺 **5. Energy Usage by 10-Inch TV** Finally, let’s zone into the world of entertainment with the energy usage of a 10-inch TV. This chart is a rollercoaster with spikes in power usage that likely mirror our binge-watching sessions. A closer look at when and how these spikes occur could unravel the mysteries behind household energy consumption spikes. **Summary** Wrapping up, our charts are like open books, offering insights albeit with a few missing pages. The journey through stable power outputs, steady temperatures, and those dramatic TV energy spikes gives us tons to ponder. Although gaps in humidity and cloudiness data do throw a curveball, it’s a chance to improve our data tactics for even sharper strategies ahead. Stay tuned for more data-driven adventures! 🚀 And remember, every chart and data point tells a story, let’s keep listening. #EnergyTrends #DataInsights #Sustainability #SmartLiving #TechSavvy 🌍http://www.stromfee.graphics/images_sshot/leonardo_image_20250525_142221_1.png
Read more
- AI Cooling , Europe Cooling , Russia , South Asia , U.A.E. and East Asia , USA
- May 27, 2025
- 0 views
**Motor Performance Deep Dive: Decoding 48-Hour Operational Insights**
Views: 1**📈 Motor Performance Data Insights: Navigating Through Alerts and Peculiarities** Hey everyone! 🌟 Let’s dive into the latest insights from our motor performance data over the past 48 hours. Grab a cup of coffee, and let’s unravel these numbers together! ☕️💡 **1. Power Prices Alert!** 🚀 Noticed those zigzags on the power price chart recently? We hit a high of €103! It seems like something’s cooking during those early morning hours of the 22nd—could be high demand or just shy supply. Keeping an eye on these spikes is key to managing our costs and staying ready for sudden jumps in demand. 📊 **2. Motor Power Output: Steady As She Goes** 🔧 Our motor is humming along nicely with power output readings showing consistent performance – 1.72 kW currently, averaging at 1.65 kW, and a peak at 1.78 kW. Looks like everything’s operating within the safe zone—no drama of overload or malfunctions here! 🌿 **3. Grid Voltage Levels: Smooth Sailing** ⚡️ Voltage levels? As stable as your favorite playlist. We’re talking 241 V now, with an average of 240 V and a high of 247 V. It’s all within the safe range, but let’s stay alert to any unexpected dips or spikes that might throw a wrench in the works. 🛠️ **4. Power Factor Analysis: Time for a Tune-Up?** 📉 Diving into the power factor numbers, we’re a bit below the ideal with a current of 0.697, averaging 0.686, and maxing out at 0.703. Not quite at perfect harmony (1.0), suggesting we could fine-tune things to boost efficiency and cut down on energy losses. Let’s keep an eye on this! 👀 **5. Motor Current Readings: All Clear!** 🌟 Motor current readings are looking good! Current at 3.41 A, average at 3.34 A, and a maximum of 3.61 A. It’s all within expected limits—no signs of stress or strain here. Continuous monitoring will keep us ahead of any potential hiccups. 📈 **🔍 In Summary:** Overall, things are looking pretty stable. 🌈 However, there’s always room for improvement, especially with our power factor needing some attention to shine brighter. And though those power price peaks might make a dent in the wallet, there’s nothing too alarming in the past couple of days. Let’s keep a vigilant watch and aim for even smoother operations! 🚀 Stay engaged, stay informed, and let’s keep those motors running efficiently! #MotorInsights #EnergyEfficiency #StayTuned Cheers to optimizing and overcoming challenges together! 🎉http://www.stromfee.graphics/images_sshot/leonardo_image_20250523_054236_1.png
Read more
- AI Cooling , AI Heating , USA
- May 27, 2025
- 0 views
**Harrisburg’s Climate and Energy: A Data-Driven Snapshot**
Views: 0Title: **Unpacking the Patterns: A Peek at Harrisburg’s Weather and Energy Use!** 🌡️☁️⚡ Hey everyone! Ready for a breezy dive into the climate and energy vibes of Harrisburg, USA? Let’s break down what’s happening in terms of temperature, humidity, cloud cover, and how it all ties into our energy habits! 🌞 **Temperature Talk** In Harrisburg, our temperatures are chillin’ at a comfy peak around 12°C. What’s cool is how steady things stay – no wild swings here! It’s like Harrisburg has found its temperature sweet spot, perfect for those who prefer a more predictable climate. 💧 **Diving into Humidity** Next up, let’s talk moisture! Our humidity levels are playing it cool between 78%-80%. It’s consistently cushy, but keep an eye on those occasional dips and rises. They might just sync up with your daily routines or shifts in the weather. Ever notice how some days feel stickier than others? It’s all in the data! ☁️ **Cloudy Conundrums** On the cloud front, we’re mostly seeing a steady scene with cloud coverage hovering around 30%-40%. Got a spike here and there though, hinting at brief shifts that shake up our usual overcast days. Always good to keep a light jacket handy, right? 📺 **Energy Insights: TV Edition** Switching gears to energy use, specifically our trust in the good old 10-inch TV. Energy spikes around 8W suggest some of us are catching up on shows mostly during certain hours. Noticed those midday jumps at noon? Might be lunch break binge-watchers in action! But generally, it looks like we’re not TV addicts in the wee hours. 🔍 **Overall Thoughts** All in all, our look at the data shows Harrisburg rocks a pretty steady climate game with some neat little patterns in how and when we use energy. It’s great to see how even small fluctuations can tell us a lot about our daily lives and choices! Thanks for tuning in to today’s weather and energy analysis of Harrisburg! Remember, whether it’s a bit more cloud cover or planning your TV time, there’s a rhythm to everything! 🌤️🌬️📺 #WeatherWhiz #EnergyTrends #HarrisburgHappenings #DataDivehttp://www.stromfee.graphics/images_sshot/leonardo_image_20250525_141213_1.png
Read more
- AI Cooling , Europe Cooling , Russia , South Asia , U.A.E. and East Asia , USA
- May 27, 2025
- 0 views
Motor Performance Insights: A 48-Hour Data Analysis Breakdown
Views: 0Hey everyone! 😊 Let’s dive into the fascinating world of motor operations with a quick rundown on a 48-hour data analysis we did. If you love getting into the nitty-gritty of how things work, this is for you! 🔹 **Motor Power Analysis** First off, the motor is currently pulling 1.69 kW of power – not too shabby! On average, it’s been at 1.64 kW, peaking at 1.78 kW. These fluctuations are something to watch; they hint at how the workload changes. You know, like those sudden bursts of energy you get when your favorite song comes on! 🔹 **Voltage Stability Assessment** Voltage is pretty stable at the moment (244 V). It mostly hovers around 240 V but has hit 247 V at its peak. It’s like staying in your comfort zone but occasionally stepping out to stretch – as long as it doesn’t dip too low too often, we’re good. Stability for the win! 🔹 **Power Factor Evaluation** Let’s talk efficiency – the power factor is sitting at 0.687. It’s like the motor’s way of telling us how effectively it’s using the electricity. Higher is better, and while it’s not perfect, it’s fairly stable. Think of it as keeping your balance while walking on a beam – you want to stay as centered as possible! 🔹 **Motor Current Examination** Current use is at 3.36 A, generally staying around 3.31 A, but it has reached up to 3.61 A. That spike is our cue that the motor might be pushing a bit too hard. It’s like when you’re carrying groceries – too heavy, and you risk dropping them, right? To sum it all up, keeping an eye on how power, voltage, power factor, and current change is super important. It helps us catch any odd behaviors early – like when your car starts making that weird noise. Regular checks can steer us clear of trouble and keep things running smoothly. That’s it for now! Do keep tabs on these markers if you’re handling motors – stay safe, efficient, and keep the energy up! 👍 #MotorMonitoring #EnergyEfficiency #SmartOperations Feel free to share your thoughts or questions below! Let’s keep the conversation going. 💬✨http://www.stromfee.graphics/images_sshot/leonardo_image_20250522_234238_1.png
Read more
- AI Cooling , Europe Cooling , Russia , South Asia , U.A.E. and East Asia , USA
- May 26, 2025
- 0 views
Technical Performance Analysis: Motor Power and Efficiency Insights
Views: 0🌟 **Hello Motor Enthusiasts! Dive Into the Latest Motor Operation Insights!** 🌟 🚀 **Power Price Trends** Hey there! Have you seen how power prices dance around during the day? Our recent data shows prices dip during off-peak hours – yay for savings! But heads up, they do spike during the busy times. Keep an eye on these patterns to avoid surprises and save some pennies! #PowerSavings #SmartRunning 🔋 **Motor Power Output Analysis** Ever wonder how your motor’s really doing? We’ve monitored the power outputs and good news – they’re hitting as high as 1.78 kW consistently. Just remember, staying vigilant about any ups and downs in performance can help catch any sneaky issues early on. #StayAlert #MotorHealth ⚡ **Network Voltage Monitoring** Voltage can be a tricky beast, swinging up to 247 V! While that’s a tad high, mostly it sticks around 240 V. It’s important to watch these fluctuations. Too high or too low could mean trouble, so keeping tabs could really save the day. #VoltageCheck #SafeOperation 🔄 **Power Factor Insights** Power factor fun fact: we’re averaging at about 0.685, folks! While it’s pretty stable, we’re still shy of the ideal 1.0 mark. Improving this could mean less strain on your motor and more cost-efficiency. Who doesn’t like saving money and energy? #EfficiencyExpert #PowerFactorFun 🔌 **Motor Current Analysis** Current usage looks steady with an average around 3.29 A. Even in the peaks at 3.61 A, things are under control. It’s all about keeping an eye on these numbers to prevent potential overload – better safe than sorry! #CurrentWatch #StableAndSteady 📊 **Summary of Key Insights** In a nutshell, our motors are doing pretty well, but let’s stay on our toes. Watching for voltage peaks and unexpected current spikes is key. A little tweak in our power factor could also lead to big wins in efficiency and cost. Let’s keep our motors running smoothly and avoid any hiccups! #MotorMaintenance #StayEfficient Stay curious, stay efficient, and let’s keep those motors in top shape! 💪 #MotorMagic #EfficiencyWinshttp://www.stromfee.graphics/images_sshot/leonardo_image_20250522_174238_1.png
Read more
- AI Cooling , Europe Cooling , Russia , South Asia , U.A.E. and East Asia , USA
- May 26, 2025
- 0 views
🚀 Motor Performance Insights: Tracking Efficiency & Stability 🚀
Views: 0🌟 **Motor Magic: Keeping Our Operations Smooth & Efficient!** 🌟 Hey everyone! Let’s take a quick dive into how our motors have been doing over the last 48 hours. We’ve got some cool insights that’ll help us keep everything running like a dream! 🛠️💡 📉 **Electricity Price Check** Good news! The electricity prices have been super steady at €105. No wild swings mean no surprises on our bills! Let’s keep an eye out, though, to catch any sudden changes. 🧐 🚀 **Motor Performance Update** Our trusty motor is chugging along brilliantly with a load between 1.61 kW and 1.76 kW. These numbers tell us we’re right on track. Just a heads up—let’s stay sharp and watch out for any unusual jumps or dips in performance. ⚡ **Voltage Vibes** Voltage has stayed within the safe zone, averaging around 241 V. There’s a tiny nudge to 247 V, but nothing to worry about just yet. Still, let’s make it a point to look out for any dips that might make our motor unhappy. 🔌 **Power Factor Peek** Our current power factor is hanging out between 0.674 and 0.704. Although it’s a bit lower than perfect, it’s not a biggie right now. But yeah, boosting this number could make things even smoother. We’re on it! 📊 **Current Draw Details** The current draw’s looking stable too, ticking at about 3.61 A. Consistency is key, so this is great! But, as always, if this starts creeping up, it might be time for a quick checkup to avoid any overload drama. 🔍 **Summing It Up!** All in all, our motors are performing solidly with stable electricity costs and current draw. Voltage levels and power factors are in check, but deserve a close watch. It’s all about keeping things running at their best, so let’s continue to monitor these metrics closely. Stay tuned for more updates! Let’s keep our operations efficient and our motors happy! 🌟 #MotorMaintenance #OperationEfficiency #VoltageCheck #EnergySmart #MotorMetricshttp://www.stromfee.graphics/images_sshot/leonardo_image_20250522_114439_1.png
Read more
- AI Cooling , AI Heating , USA
- May 26, 2025
- 0 views
Environmental Data Insights: Tracking Sustainability and System Stability
Views: 1**Title: Unraveling Environmental Data: A Simple Guide to What’s Going On** Hey eco-warriors! 🔍🌍 Let’s dive into the data and see what it tells us about how we’re doing in maintaining a stable environment with our current tech and practices. Here’s a snapshot of some key trends we’ve been following: **1. Power Consumption Metrics** Starting with the basics: our current power usage is sitting pretty at 20 mW. It might seem like we’re stuck on this number, but keeping it consistent is kind of a win in maintaining efficiency! We’ll keep an eye on it to see if anything shakes things up. ⚡ **2. Temperature Analysis** Next up, temperatures are holding steady, which is great news for our system’s stability. No wild swings mean our equipment and environment are in a happy balance. Let’s stay alert for any unusual dips or spikes, though. 🌡️ **3. Humidity Levels** Checking the air around us, humidity is hanging around 70%. It’s smooth sailing for now with no big changes, which helps everything run without a hitch. We’ll monitor this to make sure it stays on track. 💧 **4. Cladless Metrics** Similar to humidity, our cladless data isn’t showing much drama. Things are stable, which usually means all systems go! However, we’re curious creatures, so we’ll keep revisiting these numbers to catch any shifts early. 📊 **5. Energy Consumption of 10-inch TV** Here’s where it gets interesting! Our little TV’s power use is a bit more up and down. It looks like our binge-watching might be influencing this – something to think about for our next movie marathon. 📺 **Conclusion** Overall, we’re looking pretty stable but that TV energy spike deserves a deeper dive. Keeping tabs on these trends helps us ensure everything runs smoothly and sustainably. We’re on it, making sure we stay green and keen! Stay tuned, keep caring, and let’s make every watt count! 💚 #EcoFriendly #DataScience #SustainableLiving #GreenTechhttp://www.stromfee.graphics/images_sshot/leonardo_image_20250525_140246_1.png
Read more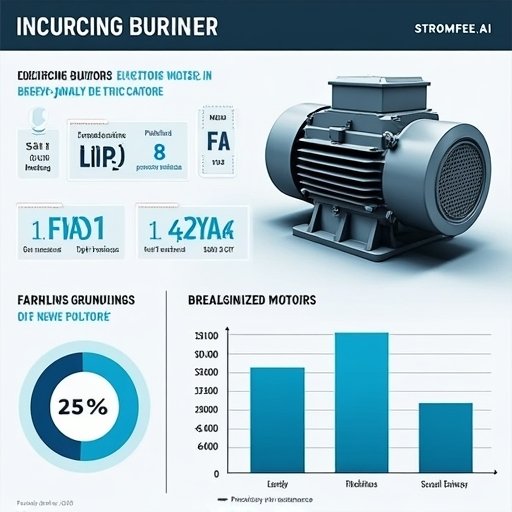
- AI Cooling , Europe Cooling , Russia , South Asia , U.A.E. and East Asia , USA
- May 26, 2025
- 0 views
48-Hour Engine Performance Analysis: Electricity Prices, Power Output, and Efficiency Insights
Views: 0🌟 Dive into Our Latest 48-Hour Engine Performance Study! 🌟 Hey, engine enthusiasts! Have you ever wondered how electricity prices can play a big role in engine performance? 🤔 Over the past 48 hours, we’ve seen quite the rollercoaster in prices with some peak highs and lows. These fluctuations are super important to monitor because they can affect how much you’re spending and how efficiently your engine runs. Yes, keeping an eye on those numbers can really save the day! #ElectricityPrices #EnginePerformance Next up, let’s talk about motor power output. Our trusty motor held pretty steady at around 1.64 kW with a max of 1.69 kW – smooth and stable, just how we like it! It’s essential to watch these numbers closely though. Any big dips could be hinting at something askew that needs a quick fix! 🛠️✨ #MotorPower #ConsistencyIsKey And what about voltage, you ask? Well, our readings were mostly consistent at 240 V, with a little spike to 247 V. That’s good news because it means our voltage supply is stable, ensuring our motor runs just right. But remember, if those numbers were to dip, it could spell trouble, so keeping a vigilant eye is crucial! #VoltageCheck #StableSupply On the topic of power factor, we noticed something interesting. Our current power factor was at 0.672—a bit below the optimal. While not immediately alarming, it’s a sign that not all the power supplied is being used effectively. It’s like paying for a whole pizza but only getting to eat a few slices! 🍕 More monitoring will help nip any efficiency losses in the bud. #PowerFactor #EnergyEfficiency Lastly, our motor current levels are exactly where they should be—no worries about overload today! But since there are slight fluctuations, staying proactive in our checks could help avoid any future hiccups. #MotorCurrent #StayProactive In short, the past 48 hours have taught us loads about maintaining efficient and cost-effective engine operations. While everything looks mostly stable, keeping our eyes peeled for any shifts in power usage and costs will help keep our engines—and our wallets—happy! Keep tuning in for more insights and happy monitoring, everyone! #EngineInsights #HappyMonitoringhttp://www.stromfee.graphics/images_sshot/leonardo_image_20250522_054242_1.png
Read more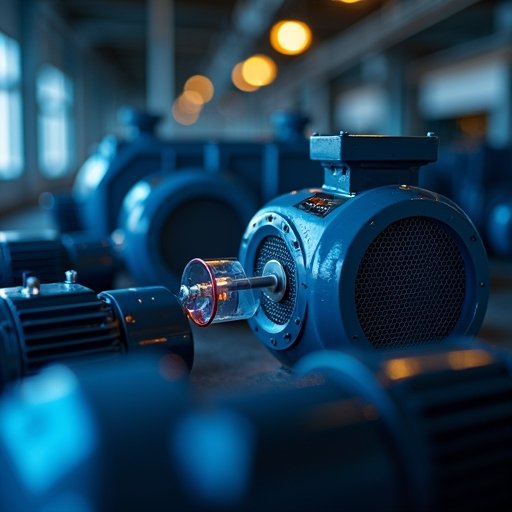
- AI Cooling , Europe Cooling , Russia , South Asia , U.A.E. and East Asia , USA
- May 25, 2025
- 0 views
Motor Performance Insights: Navigating Energy Efficiency and Operational Stability
Views: 0Hey there motor enthusiasts! 🚗💡 Let’s dive into the latest insights from our motor performance analysis—it’s pretty fascinating stuff! With a touch of data magic, we can help keep those operational costs in check! 🌟 **1. What’s the Deal with Energy Prices?** 📉 Have you seen the electricity prices lately? They’ve been like a rollercoaster over the last 48 hours, hitting a peak earlier today! This wild ride shows us just how important it is to keep an eye on market trends to make savvy decisions in motor usage. Let’s stay plugged in to save those bucks! 🔌💰 **2. Keeping Tabs on Motor Power Consumption** 📊 Our motors have been munching on electricity at about 1.66 kW recently—that’s their snack! It’s pretty steady, but let’s keep an eye on any sudden jumps in consumption. Staying alert helps us avoid any sneaky overloads. #StaySharp **3. Voltage Vibes** 🔋 Consistency is key, and our 240 volts are holding steady! It’s crucial to catch any dips below this level—it could mean a call to action to solve those low voltage mysteries. Let’s keep that voltage smooth and steady, folks! ✨ **4. Power Factor Fine-Tuning** ⚡ Our current power factor reads 0.684, indicating a bit of room for improvement. By tackling these inefficiencies, we can boost energy efficiency and keep costs low. Let’s shape up that power usage! #EnergySmart **5. Monitoring Motor Current** 🔄 Our motor currents are chill at 3.36 A, but, like a good detective, we’ll keep an eye out for any unexpected spikes. Keeping things balanced ensures our motors run like a dream. #MotorHealth **Summary of Key Takeaways** 📝 Overall, our motors are doing their thing within the normal zones—solid performance, stable voltage, and manageable power munchies. But, let’s not get too comfy! Monitoring changes in power factor and current draw is our secret weapon to prevent any hiccups and keep our operations smooth sailing. 🚀 Thanks for tuning in! Remember, a little vigilance goes a long way in motor management. Keep those gears grinding smoothly, and let’s optimize together! #MotorMastery 😊🔧 Keep buzzing with energy, and see you next time for more insights! 🌈✨http://www.stromfee.graphics/images_sshot/leonardo_image_20250521_234241_1.png
Read more


# Sonnenernte im Überblick: Unsere PV-Anlage auf Höchstleistung
- August 2, 2025
- 0 views
