
Stromfee
Energietrends: Städte, Erneuerbare und der Strommarkt im Überblick
5. Apr. 2025
Stromfee
Sonnige Spitzenleistungen: Ein Tag mit unserer 1000 kWp PV-Anlage
4. Apr. 2025
Stromfee
Leistungsanalyse unserer 1000 kWp Photovoltaik-Anlage: Ein sonniger Überblick
4. Apr. 2025
Stromfee
Leistungsanalyse unserer 1000 kWp Photovoltaik-Anlage: Sonnenkraft auf dem Prüfstand
3. Apr. 2025
Stromfee
24 Stunden Einblick: Performance unserer 1000 kWp Photovoltaik-Anlage
3. Apr. 2025
Stromfee
Energieanalyse unserer 1000 kWp Photovoltaikanlage: Sonnenpower im Überblick
3. Apr. 2025
Stromfee
Dynamische Energieperformance: Einblicke in deine Photovoltaik-Powerstation
3. Apr. 2025
Stromfee
Ein sonniger Erfolg: Unsere PV-Anlage im Leistungs-Check!
3. Apr. 2025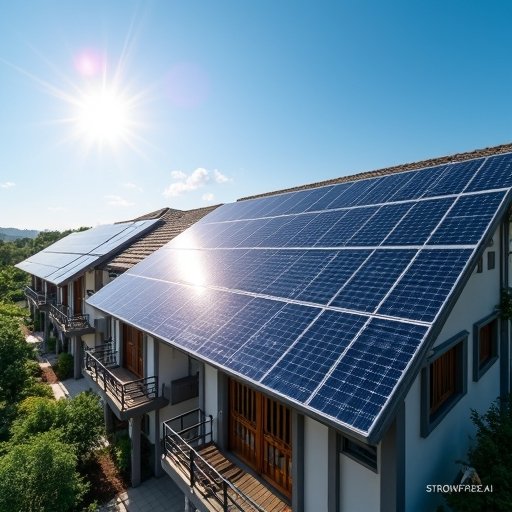
Stromfee
Leistungsanalyse einer 1000 kWp Photovoltaik-Anlage: Effizienz, Herausforderungen und Potenziale
3. Apr. 2025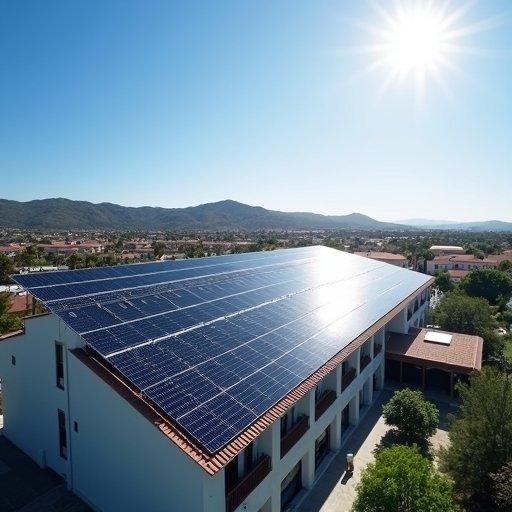
Stromfee
Energieanalyse und Performance-Evaluation der 1000 kWp Photovoltaik-Anlage: Technische Einblicke und Leistungsdaten
2. Apr. 2025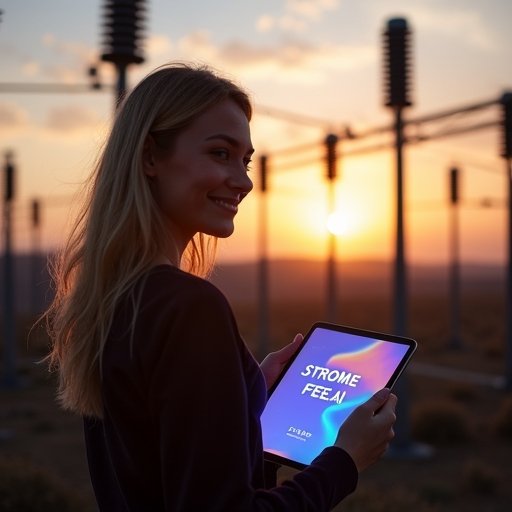
Stromfee
Energiedynamik: Solarstrahlung, Netzfrequenz und Preisanalyse im Überblick
2. Apr. 2025
Stromfee
Energiesensorik entdecken: Wie Wetter und Technik unseren Stromfluss beeinflussen
2. Apr. 2025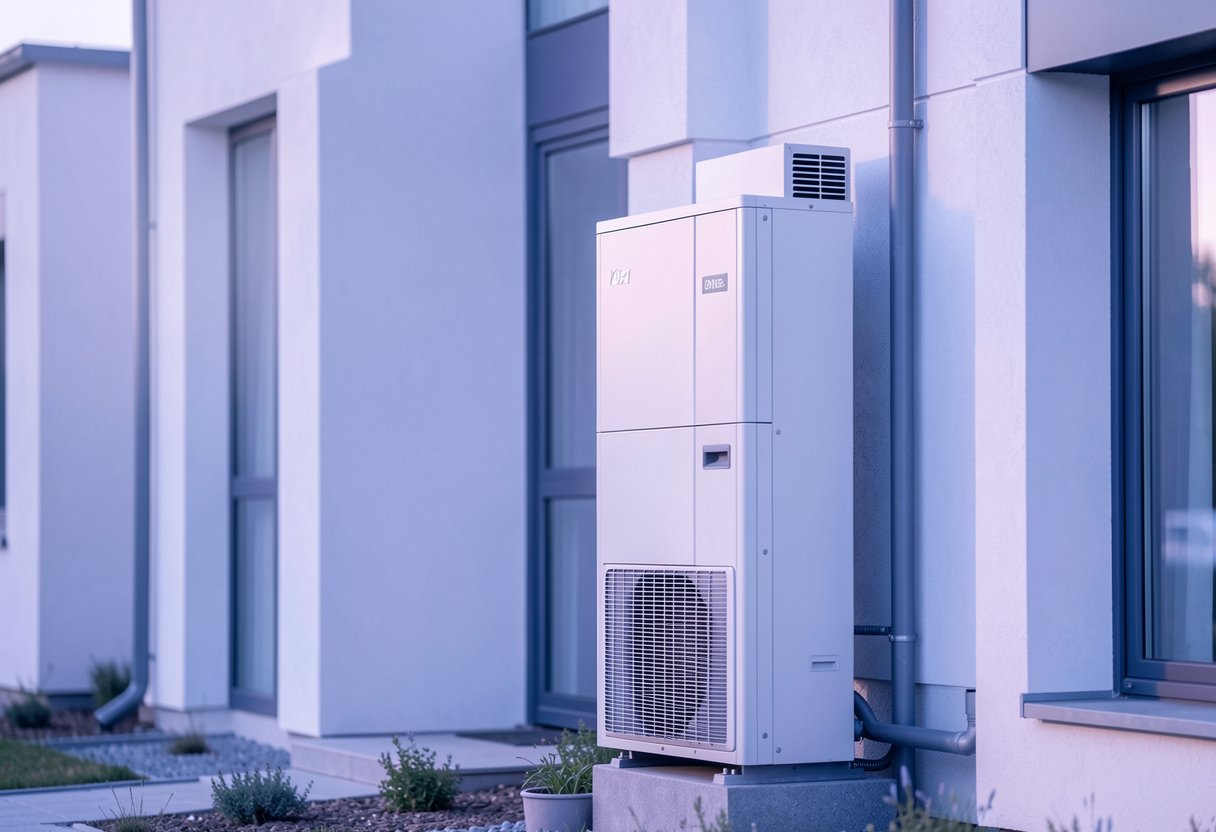
Stromfee
Temperaturtrends und Heizeffizienz: Ein Blick auf unsere Wärmeversorgung
2. Apr. 2025
Stromfee
Temperaturtrends: Intelligente Heizstrategien für Komfort und Effizienz
31. März 2025
Stromfee
Energieproduktion und Verbrauchsmuster: Ein dynamischer Überblick
30. März 2025
Stromfee
Stromverbrauch entschlüsselt: Trends, Peaks und Überraschungen im Energiealltag
30. März 2025
Stromfee
Temperatur- und Leistungsanalyse: Einblicke in moderne Wärmepumpentechnologie
29. März 2025
Stromfee
Wärmepumpen-Tagebuch: Temperatur-Trends und Energiegeheimnisse enthüllt!
28. März 2025
Stromfee
Heizungsdaten-Analyse: Einblicke in die Performance unserer Daikin Wärmepumpe
28. März 2025
Stromfee
"Powering Up: A Tech Studio's Energy Journey and Insights"
28. März 2025
Stromfee
Power Play: An Insider's Look at Our Studio and Office Energy Dynamics
28. März 2025
Stromfee
Tech Energy Insights: Unveiling Our Office Power Dynamics
27. März 2025
Stromfee
Power Pulse: Decoding the Energy Symphony of Workplace Workstations
27. März 2025
Stromfee