Hitzewelle in New York: Energietrends und Herausforderungen im Klimawandel
Views: 0Hey Leute! 🌞 Hat jemand die letzten Tage in New York erlebt? Es wurde richtig warm, und ich spreche nicht nur von den Sommerhits im Radio! Wir hatten Spitzenwerte von bis zu 30 °C – eine echte Hitzewelle, die unseren Energieverbrauch und die Notwendigkeit für Kühlung ziemlich nach oben getrieben hat. 🌡️ #NewYorkWetter #Hitzewelle Apropos Energie – gibt es hier Solar-Fans? 🌞 Unsere Photovoltaikanlage in New York hat leider ein paar Datenlücken, was ein bisschen besorgniserregend ist. Entweder haben wir ein technisches Problem oder die Anlage konnte zeitweise nicht genug Power liefern. Das macht es schwierig, genau zu wissen, wie effizient unser grünes Kraftwerk läuft. #SolarPower #EnergieEffizienz Wenn wir schon beim Thema Energie sind: Die Schwankungen im Energieverbrauch sind ziemlich intensiv. Im Spannungsfeld zwischen -40 kW und +40 kW zeigt sich, dass vor allem die Klimaanlagen bei der Hitze voll laufen. Diese Spitzen könnten ein Zeichen dafür sein, dass unser Energienetz und die Systeme besser angepasst werden müssen, um mit diesen extremen Bedingungen klarzukommen. ⚡ #Energieverbrauch #Stromnetz Zusammengefasst – es ist immer spannend, die Energie- und Temperaturtrends in New York zu beobachten. Sie sind ein wichtiger Indikator dafür, wie wir unsere Infrastruktur verbessern und effizienter gestalten können. Plus, es gibt uns Einblicke, wie wir den Herausforderungen des Klimawandels besser begegnen können. Lasst uns dafür sorgen, dass unsere Stadt bereit ist! 🏙️ #Nachhaltigkeit #ZukunftGestalten Teilt eure Gedanken und bleibt energiegeladen! 🔋💚http://www.stromfee.graphics/images_sshot/leonardo_image_20250329_085120_1.png
Read moreEnergieeffizienz im Büro: Smarte Einblicke in unseren Stromverbrauch
Views: 0Hallo ihr Lieben! 🌟 Heute haben wir spannende Einblicke in unseren Energieverbrauch und wie wir die Energieeffizienz verbessern können. Hier ein kurzer Überblick: 1. **Michelles PC** 🖥️ – Der rockt mit einem Maximalverbrauch von 176 W, typisch bei 31,4 W. Schwankt vor allem bei aufwendigen Projekten wie Videobearbeitung oder beim Gaming. Voll Power, oder? 2. **TV Studio** 📺 – Hier geht’s richtig ab! Bei einem Spitzenverbrauch von 314 W sollten wir vielleicht überlegen, wie wir smarter arbeiten können. Interessant: Die größte Auslastung gibt’s um die Mittagszeit und frühen Abend. Action pur! 3. **Katharinas Büro** 💼 – Ihr PC verbraucht bis zu 206 W und pendelt sich meist bei 96,8 W ein. Die Nutzung steigt besonders nach dem Lunch – typische Rush-Hour! 4. **Audio und LEDs** 🔈💡 – Diese sind mit einem Maximalverbrauch von 33,4 W ziemlich effizient. Trotzdem gibt es Momente mit höherem Verbrauch, die wir genauer ansehen sollten. 5. **Gridler TV** – Mysteriös, hier fehlen uns Daten. Bleibt spannend, was da los ist. 🕵️♂️ 6. **Maximaler Verbrauch PC 3** – Mit einem maximalen Verbrauch von 166 W und 91,9 W im Durchschnitt zeigt dieser PC, dass er gut im Rennen liegt für eine moderate Nutzung. 7. **Gesamtstrom im Büro** ⚡ – Beeindruckend effizient mit nur 9,77 kW, auch während der Stoßzeiten. Daumen hoch für unser Team! 8. **Overall Insights** – Die Daten zeigen, wie wichtig es ist, unsere Geräte bewusst zu nutzen und immer nach Verbesserungen zu suchen. Besonders im Auge behalten sollten wir die Einheiten, die keine Daten liefern. Lasst uns zusammenarbeiten, um unsere Energie smarter zu nutzen und dabei noch zu rocken! 💪 #EnergieEffizienz #SmartOffice #TechTips Freue mich auf eure Gedanken und Ideen in den Kommentaren! 🌍💬http://www.stromfee.graphics/images_sshot/leonardo_image_20250509_191533_1.png
Read moreEnergieverbrauch im Büro: Spannende Einblicke in unsere technologische Welt
Views: 0Hey zusammen! 🌟 Heute werfen wir einen spannenden Blick auf unsere Energieverbrauchsdaten und was sie uns über die Nutzung unserer Geräte verraten. Kommt mit auf diese interessante Reise! ⚡️🔍 1. **Michelles PC** 🖥 Sage und schreibe 176 W schnellt der Verbrauch hoch, wenn Michelle richtig loslegt, im Schnitt sind es aber 31,4 W. Da geht’s also manchmal heiß her, und das deutet auf wirklich spannende Projekte hin! 2. **TV Studio** 📺 Unser TV Studio toppt alles mit einem Spitzenwert von 314 W (durchschnittlich 163 W)! Ihre Schwankungen könnte auf spezielle Software oder spektakuläre Show-Effekte hindeuten – immer bereit für die Prime Time! 3. **Katharinas Büro** 💼 Auch Katharinas Büro lässt sich nicht lumpen: Peak bei 206 W und im Durchschnitt 96,8 W. Zwischen Höchstleistungen und Ruhephasen – bei Katharina ist Abwechslung Programm! 4. **Audio und LEDs plus PC** 🎵💡 Hier sind die Zahlen eher niedrig: Maximal 33,4 W und durchschnittlich 15,0 W. Klingt nach effizienter Nutzung, ohne viel Energie zu verschwenden. 5. **Grider TV** Hier fehlen uns leider Infos – das ist ein kleines Mysterium. 🧐 Wir bleiben dran! 6. **Maximal Stromfreigabe PC 3** 🖥 Mit einem stabilen Durchschnitt von 91,9 W zeigt dieser PC, dass er gut im Futter steht und gleichmäßig läuft. Sehr solide! 7. **Büro gesamt** 🏢 Unser gesamtes Büro zeigt sich extrem energiesparend mit nur 9,77 kW und einem Schnitt von 1,36 kW. Da scheinen einige Energiesparmeister am Werk zu sein! 👍 **Zusammenfassung:** Unsere Analyse zeigt, wie unterschiedlich die Energieverbräuche sind. Manche Geräte sind echte Powerhouses bei besonderen Aufgaben, andere Modelle der Effizienz. Jede Spitzenlast ist ein Hinweis darauf, dass etwas Cooles passiert! Solche Einblicke helfen uns, noch smarter mit unseren Ressourcen umzugehen. 🌍💚 Lasst uns wissen, welche Insights euch am meisten überrascht haben! #EnergieEffizienz #SmartOffice #TechInsightshttp://www.stromfee.graphics/images_sshot/leonardo_image_20250509_131534_1.png
Read moreWetter und Energie in New York: Ein spannender Einblick in Temperatur und Solarleistung
Views: 0Hey, liebe Community! 🌞🌆 Lasst uns mal einen coolen Blick auf die Wetter- und Energie-Infos aus New York werfen! Hier kommen zwei spannende Punkte: 1️⃣ **Außentemperaturen in New York**: Habt ihr euch jemals über das Wetter in New York während eines typischen Zweitagezeitraums gewundert? Die Temperaturen schwankten neulich zwischen 20 °C und 30 °C. Ganz schön warm, nicht? Besonders gegen Ende gab es eine Hitzewelle – die Temperaturen kletterten nach oben! Übrigens: Nachts wird es kühler, tagsüber heißer – klassisches Großstadtwetter! 2️⃣ **Photovoltaik-Leistung**: Und jetzt zur Power der Sonne! 🌞 Eine Photovoltaikanlage dort packt bis zu 187 kWp. Die Leistung variiert zwischen -297 W und 82,2 kW. Am Tag zeigt die Anlage ihre Muskeln, während sie nachts fast pausiert. Interessant ist ein negativer Leistungswert, der ein Hinweis darauf sein könnte, dass mehr Energie verbraucht als produziert wurde – ein kleiner Reminder, dass Energiemanagement super wichtig ist! **Zusammenfassung**: Die Außentemps und die Energieleistung verbinden Wetter und Tageszeit direkt miteinander. Das kann echt helfen, die Energieversorgung besser zu steuern. Außerdem könnte dieses Wissen dabei helfen, Energieverbrauch und Solarenergieerzeugung in urbanen Gebieten zu optimieren! 🌍💡 Spannend, oder? Bleibt dran für mehr Insights und Tipps rund um Energie und Umwelt! #NewYork #Energie #SolarPower #Umweltbewusst Habt einen energetischen Tag! 🚀🌟http://www.stromfee.graphics/images_sshot/leonardo_image_20250329_084112_1.png
Read moreEnergieverbrauch beim Fernsehen: Eine Reise durch Janinas Wohnzimmer und Fußballzimmer
Views: 0Hallo liebe Energiebewusste 🌟! Heute nehme ich euch mit auf eine spannende Entdeckungsreise durch die Welt der Energiemessung in unserem Zuhause 🏡. Wir schauen uns an, wie der Fernsehkonsum wirklich aussieht – und wo wir vielleicht ein paar Energieeinsparungen hinzaubern können! 🌱✨ 📺 **Im Wohnzimmer von Janina** erreichte der Fernseher einen beeindruckenden Spitzenwert von 350 mW in den frühen Morgenstunden um 14:30 Uhr – für alle Nachteulen unter uns! 🌜Dagegen zeigte sich in den Abendstunden zwischen 21:00 und 22:30 Uhr mit nur 100 mW ein absoluter Tiefstwert. Ganz schön interessant, wie unterschiedlich die Zeiten genutzt werden, oder? ⚽ **Und jetzt ab ins Fußballzimmer**: Hier sind die Zahlen viel niedriger, der Höchstwert lag bei nur 16,1 mW! Die Werte vor und nach diesem Zeitpunkt schwankten zwischen 2 mW bis 10 mW, was darauf hindeutet, dass hier deutlich weniger Fernsehzeit angesagt ist. Vielleicht ist das ja der perfekte Ort für ein kleines Energiesparziel? ⚽📉 🔍 **Zusammengefasst**, das Wohnzimmer erlebt deutlich mehr Fernsehaction, besonders zu typischen TV-Zeiten wie 18:00 und 20:00 Uhr – das sind wohl unsere Prime Times! Im Fußballzimmer hingegen herrscht eher Ruhe. Diese Unterschiede in den Nutzungszeiten könnten ein Schlüssel für zukünftige Energieeffizienz sein. Es lohnt sich also, genau hinzuschauen! 🔎💡 Was denkt ihr über diese Erkenntnisse? Könntet ihr euch vorstellen, euer TV-Verhalten anzupassen, um Energie zu sparen? Teilt eure Gedanken und Tipps mit der Community! 🌍 #Energieeffizienz #Nachhaltigkeit #SmartHome #Energiesparen #Zuhause Lasst uns gemeinsam smarter und nachhaltiger werden! 🌿📊http://www.stromfee.graphics/images_sshot/leonardo_image_20250510_200251_1.png Biogasanlage
Read moreEnergieverbrauchsanalyse: Einblicke in den Stromkonsum unserer Büro-PCs und Geräte
Views: 0**Energieverbrauchsanalyse der Stromverbrauchsdaten** Hallo zusammen! Wir haben einen spannenden Einblick in unsere Stromverbrauchsdaten gewonnen, den ich gerne mit euch teile. Es ist faszinierend zu sehen, wie die verschiedenen Geräte in unserem Alltag Energie verbrauchen. 🌟 **Michelle PC** Unser Michelle-PC macht richtig was her mit einem Spitzenverbrauch von 176 W, im Schnitt liegt er aber nur bei 31,4 W. Anscheinend gibt es da bestimmte Momente, in denen er richtig Power gibt! Vielleicht finden wir noch heraus, wann und warum das passiert. 🔍 **TV Studio** Das TV Studio hat seine ganz eigenen Herausforderungen: Ein Höchstverbrauch von 314 W und durchschnittlich 163 W. Die Auslastung ist recht stabil, aber die gelegentlichen Stromspitzen deuten darauf hin, dass hier manchmal mehr los ist, als erwartet. Spannend, oder? 📺 **Katharina Büro** Der Büro-PC von Katharina zeigt auch eine interessante Differenz: maximal 206 W und durchschnittlich 96,8 W. Längere Arbeitsphasen könnten der Grund für diese Schwankungen sein – wer kennt’s nicht? 💻 **Audio und LEDs PC** Unser Spezialist für Audio und LEDs ist mit einem Maximalverbrauch von 33,4 W und einem Durchschnitt von 15 W ein ziemlich konstantes Licht in unserem Technik-Ozean. Hier schauen wir noch, ob alles optimal läuft. 💡🎵 **Maximaler Stromverbrauch PC 3** Dieser PC zeigt sich mit 166 W Spitze und 91,9 W im Durchschnitt ebenfalls recht effizient, allerdings mit einigen auffälligen Schwankungen. Spannend zu untersuchen, was dahintersteckt! 🕵️♂️ **Allgemeiner Bürostromverbrauch** Hier sieht es super aus: Ein sehr niedriger Maximalwert von 9,77 W und 1,36 kW Durchschnitt zeigen uns, dass wir im Großen und Ganzen ziemlich effizient sind. Weiter so! 🌍 **Zusammenfassung** Ein Blick auf die Daten zeigt, wie unterschiedlich unsere Geräte genutzt werden und wo vielleicht noch Raum für Verbesserungen besteht. Die regelmäßige Überwachung ist der Schlüssel zur Optimierung unserer Energieeffizienz. Lasst uns gemeinsam daran arbeiten, Energie und Kosten zu sparen! ✅ Fasziniert von Strom? Lasst uns in den Kommentaren diskutieren! #Energieeffizienz #Stromsparen #Technikliebehttp://www.stromfee.graphics/images_sshot/leonardo_image_20250509_071531_1.png
Read moreEnergiedynamik in New York: Wenn Temperaturen und Solarpower tanzen
Views: 0Hey Leute! ☀️🌡️ Heute werfen wir einen Blick auf das spannende Zusammenspiel von Temperaturen und Energieverbrauch in New York. Hier ist, was passiert! 1️⃣ **Temperaturen draußen in NYC**🏙️: In den letzten zwei Tagen zeigte das Thermometer zwischen 20°C und 30°C. Besonders mittags kletterten die Temperaturen nach oben, bevor sie gegen Abend wieder sanft fielen. Diese Spitzen lassen vermuten, dass dann die Klimaanlagen auf Hochtouren laufen. Brrr, ist das heiß hier, oder? 🔥😉 2️⃣ **Solar Power**🌞: Ein 187 kWp Solarpanel in New York hat echt Power! Wenn die Sonne knallt, boomt auch die Energieerzeugung, genau dann, wenn wir sie am meisten brauchen. Die Spitzenleistung lag bei starken 82,2 kW! Nachts sinkt die Energie natürlich, da müssen wir dann auf das Stromnetz zurückgreifen. 💡🌃 3️⃣ **Energieverbrauch – Ein Wechselspiel**⚡: Der Energiehunger von New York zeigt sich in Wellen – mal rauf, mal runter, ganz abhängig von der Temperatur. Wenn die Sonne sich mal von ihrer müden Seite zeigt, müssen wir zusätzlichen Strom zukaufen. Das unterstreicht, wie wichtig gutes Energiemanagement ist! **Zusammenfassung**: Die Daten offenbaren, wie Außentemperaturen und Sonnenschein direkt unseren Energiebedarf beeinflussen. An extrem heißen Tagen steigt der Verbrauch, und unsere Solarmodule sind voll gefordert. Um nicht ins Schwitzen zu kommen und Energiekosten zu sparen, könnte es sich lohnen, in Speichersysteme zu investieren. Klingt nach einer sonnigen Zukunft, oder? 😎☀️🔋 Lust auf mehr spannende Infos? Behaltet die Trends im Auge, denn jede Wetteränderung erzählt uns eine neue Geschichte über unsere Stadt! Bleibt energiegeladen! 💪 #NewYorkEnergie #SolarPower #Nachhaltigkeit Bis zum nächsten Update, bleibt cool und spart Energie! 🌍💚http://www.stromfee.graphics/images_sshot/leonardo_image_20250329_083119_1.png
Read moreEnergieverbrauch im Tech-Alltag: Eine Analyse unserer PCs und Geräte
Views: 0Hey, liebe Tech-Fans! 🌟 Ich habe spannende Neuigkeiten für euch, die alle, die sich für Technologie und Energieeffizienz interessieren, faszinieren werden! Wir haben eine kleine Analyse durchgeführt, die zeigt, wie unterschiedlich die Energieverbrauchswerte unserer verschiedenen PCs und Geräte sind. Lasst uns das gemeinsam erkunden! 🖥️ **Michelle PC in Aktion!** Unser Michelle PC kann bis zu 176 W schlucken, wenn er voll powert, liegt aber im Schnitt bei nur 31,4 W. Klar, bei aufwendigen Games oder Anwendungen muss er auch richtig ran! Spannend, wie flexibel er sich den Aufgaben anpasst, oder? 📺 **Power im TV Studio** Der TV Studio-PC spielt in einer anderen Liga: mit Spitzenwerten von bis zu 314 W und einem Durchschnitt von 163 W! Das deutet darauf hin, dass er bei intensiven Bearbeitungs- und Streaming-Sessions voll gefordert wird. Echt beeindruckend! 👩💼 **Doppel-Power im Büro von Katharina** Hier haben wir zwei Versionen: Katharina Büro und Büro Gen2. Beide zeigen starke Leistung mit Spitzen bis 206 W und einem soliden Mittelwert. Es scheint, als ob hier oft parallel gearbeitet wird – Teamarbeit macht eben Spaß! 🔊💡 **Energiebündel Audio und LED-PCs** Hier geht’s ruhiger zu: Maximal 33,4 W und im Durchschnitt sogar nur 15 W. Sieht so aus, als wären diese PCs die Sparfüchse unter den Geräten – top für gelegentliche Nutzung! 📊 **Besondere Einsichten** Leider haben wir aktuell keine Daten für den Grider TV, und der 19 Zoll LED-Bildschirm scheint gerade Pause zu machen. Eine kleine Erinnerung, unsere Tools immer mal zu checken. 😉 💼 **Maximaler Strom? Büro-PC 3** Dieser PC zeigt uns, wie dynamisch der Büroalltag sein kann: bis 166 W in Hochphasen und rund 92 W im Durchschnitt. Klingt nach viel Multi-Tasking! 🏢 **Ruhe im Büro** Ein Blick auf die Gesamtbelastung verrät: Wenn weniger los ist, fällt der Stromverbrauch im Büro auf super-schlanke 9,77 W zurück. Juhu, Effizienz-Steigerung! 🔍 **Fazit** Klar ist, hohe Peaks spiegeln intensive Nutzung wider, wohingegen andere Geräte mit Mini-Verbrauch punkten. Super wäre es, die Nutzung bestmöglich anzupassen, um Energie und Kosten zu sparen – ein Schritt in die grüne Richtung! Vielen Dank fürs Durchlesen! Lasst uns gemeinsam effizienter und umweltbewusster werden! 💪 #TechInsights #Energieeffizienz #SmarteNutzung #Umweltfreundlichhttp://www.stromfee.graphics/images_sshot/leonardo_image_20250509_011619_1.png
Read moreEnergietrends 2023: Städte, Erneuerbare und Strompreise im Fokus
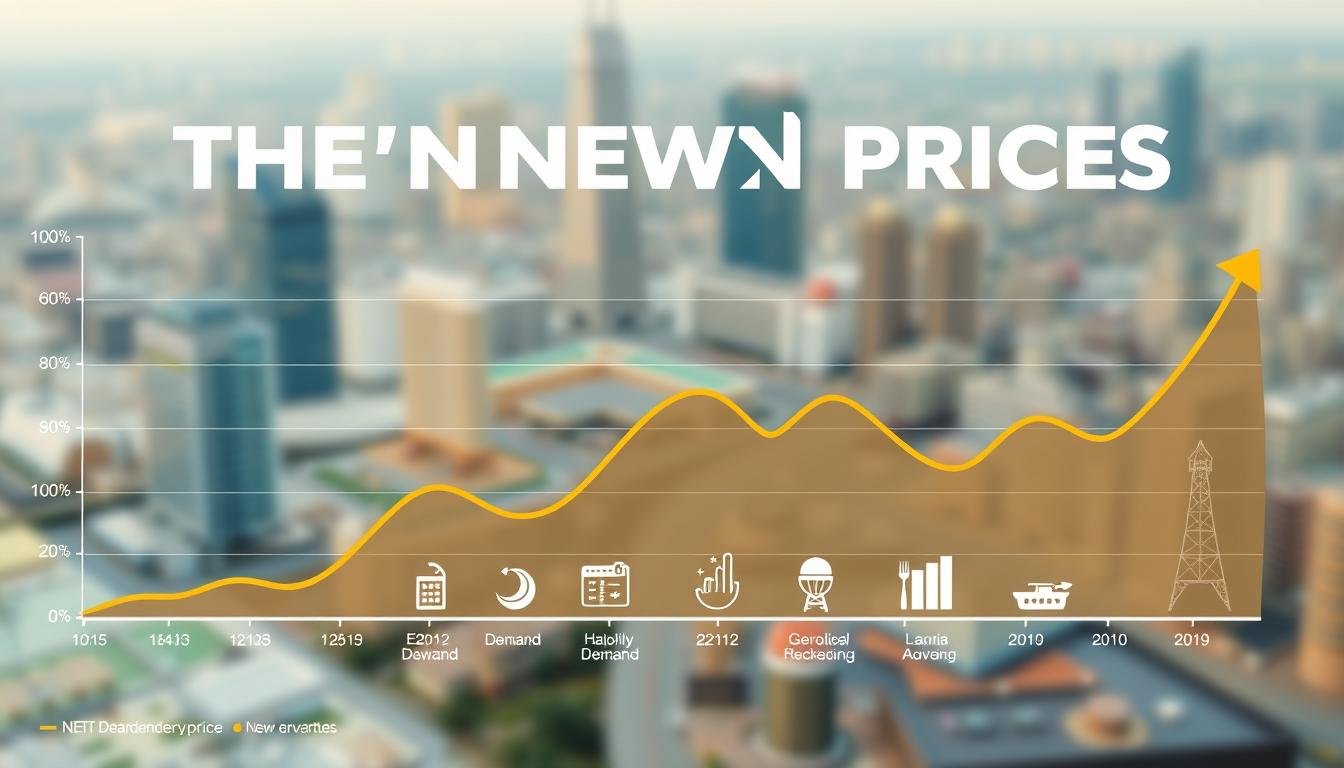
Views: 0Hey liebe Community! 🌍✨ Wir haben uns heute mal die Stromdaten genauer angeschaut und einige spannende Trends entdeckt, die wir gerne mit euch teilen möchten! #EnergieTrends #Nachhaltigkeit 📊 **Chart 1: Energieverbrauch nach Region** Ihr werdet nicht glauben, welche Unterschiede es gibt! Stadt X ist der Spitzenreiter beim Energieverbrauch – wirklich beeindruckend, oder? Aber Stadt Y zeigt, dass weniger manchmal mehr ist, mit dem geringsten Verbrauch in unserer Analyse. Besonders interessant: In Stadt Z hat sich der Energiebedarf in den letzten zwei Jahren stark erhöht, was wohl an der rasanten Stadtentwicklung liegt. 🏙️📈 🌞 **Chart 2: Erneuerbare Energien vs. fossile Brennstoffe** Hier geht’s um den Kampf der Energien! Die guten Nachrichten zuerst: Die erneuerbaren machen Boden gut, besonders Solar- und Windenergie fliegen hoch. Und die Fossilien? Die mussten in Jahr X eine kleine Niederlage einstecken – dank starker Bemühungen, unsere CO2-Emissionen zu senken. Go Green! 🌱💪 💸 **Chart 3: Preisentwicklung der Strompreise** Jetzt wird’s spannend: Die Preise für Strom hatten zuletzt eine echte Achterbahnfahrt, besonders im Jahr X mit einem kräftigen Anstieg. Schuld daran sind weltweite Marktveränderungen und lokale Engpässe. Aber hey, es sieht so aus, als würden immer mehr Leute auf nachhaltige Energie setzen, was super ist! 🚀 🔍 **Zusammenfassung** Zusammengefasst sehen wir klare Zeichen: Mehr Energieverbrauch in den Städten, ein starker Schub für erneuerbare Energien und wilde Preiswellen im Strommarkt. Diese Erkenntnisse sind super wichtig, um unsere Energiezukunft smart und nachhaltig zu gestalten. 🌟 Hoffentlich findet ihr diese Einblicke genauso spannend wie wir! Lasst uns gemeinsam für eine grünere, energieeffiziente Welt arbeiten.💡🌍 #Energiezukunft #SmartCity Bis zum nächsten Update! 📈👋http://www.stromfee.graphics/images_sshot/leonardo_image_20250329_074854_1.png
Read moreWetter und Energie: Eine New Yorker Solarstrom-Analyse
Views: 0**Analyse der Energiemuster in New York: Temperatur und Solarstrom** Hallo liebe Energiefreunde! Heute werfen wir einen spannenden Blick auf das Wetter und die Solarenergie in New York. Wisst ihr, wie sehr das Wetter tatsächlich die Energieerzeugung beeinflusst? Lasst uns das gemeinsam erkunden! 🌞🌡️ **1. New Yorker Außentemperaturen** In den letzten zwei Tagen erlebten wir in New York eine spannende Achterbahn der Temperaturen, nicht wahr? Am ersten Tag ging es erst kühl los, dann wurde es wärmer, und schließlich kletterten die Werte am zweiten Tag auf angenehme 29°C. Abends gab es dann eine kleine Abkühlung – typisch für unsere Stadt, oder? Diese kleinen täglichen Temperatur-Abenteuer sind perfekt, um den Einfluss des Wetters auf unser Leben und unsere Umwelt zu verstehen! 🌆 **2. New Yorker Solarstromerzeugung** Jetzt zum glänzenden Star unserer Analyse: der Solarstrom! Eine Photovoltaikanlage mit einer Kapazität von 187 kWp stand im Mittelpunkt und – oh Wunder – wir sehen einen interessanten Trend: Wenn die Sonne kräftig scheint, schnellt die Produktion hoch. Klar, ohne aktualisierte Daten ist das nur eine Annahme, aber stellt euch vor, wie diese Energie schwankt, genau wie unsere Temperaturen! ☀️💡 **Zusammenfassung** Zusammengefasst lässt sich sagen, dass das Zusammenspiel von Wetter und Energieerzeugung in der Stadt spannende Einblicke bietet. Nach dieser kurzen Analyse freue ich mich schon darauf, in Zukunft mehr Daten zu sehen, um wirklich zu verstehen, wie Wetterbedingungen unsere saubere Energie beeinflussen können. Lasst uns gemeinsam die Sonnenstrahlen einfangen und effizient nutzen! Teilt eure Gedanken und bleibt dran für mehr energiegeladene News! 🔋🔗 #EnergieAnalyse #NewYorkWetter #Solarstrom #Umweltbewusst — Mit dieser knappen und fröhlichen Zusammenfassung hoffe ich, dass ihr einen guten Überblick über die Temperatur und Solarstromerzeugung in New York bekommen habt! Bleibt neugierig und umarmt die Möglichkeiten der erneuerbaren Energien! 🌍💚http://www.stromfee.graphics/images_sshot/leonardo_image_20250329_081125_1.png
Read moreEnergietrends 2023: Städte, Erneuerbares und Preisentwicklung im Überblick
Views: 0Hey liebe Community! 🌍✨ Wir haben uns heute mal die Stromdaten genauer angeschaut und einige spannende Trends entdeckt, die wir gerne mit euch teilen möchten! #EnergieTrends #Nachhaltigkeit 📊 **Chart 1: Energieverbrauch nach Region** Ihr werdet nicht glauben, welche Unterschiede es gibt! Stadt X ist der Spitzenreiter beim Energieverbrauch – wirklich beeindruckend, oder? Aber Stadt Y zeigt, dass weniger manchmal mehr ist, mit dem geringsten Verbrauch in unserer Analyse. Besonders interessant: In Stadt Z hat sich der Energiebedarf in den letzten zwei Jahren stark erhöht, was wohl an der rasanten Stadtentwicklung liegt. 🏙️📈 🌞 **Chart 2: Erneuerbare Energien vs. fossile Brennstoffe** Hier geht’s um den Kampf der Energien! Die guten Nachrichten zuerst: Die erneuerbaren machen Boden gut, besonders Solar- und Windenergie fliegen hoch. Und die Fossilien? Die mussten in Jahr X eine kleine Niederlage einstecken – dank starker Bemühungen, unsere CO2-Emissionen zu senken. Go Green! 🌱💪 💸 **Chart 3: Preisentwicklung der Strompreise** Jetzt wird’s spannend: Die Preise für Strom hatten zuletzt eine echte Achterbahnfahrt, besonders im Jahr X mit einem kräftigen Anstieg. Schuld daran sind weltweite Marktveränderungen und lokale Engpässe. Aber hey, es sieht so aus, als würden immer mehr Leute auf nachhaltige Energie setzen, was super ist! 🚀 🔍 **Zusammenfassung** Zusammengefasst sehen wir klare Zeichen: Mehr Energieverbrauch in den Städten, ein starker Schub für erneuerbare Energien und wilde Preiswellen im Strommarkt. Diese Erkenntnisse sind super wichtig, um unsere Energiezukunft smart und nachhaltig zu gestalten. 🌟 Hoffentlich findet ihr diese Einblicke genauso spannend wie wir! Lasst uns gemeinsam für eine grünere, energieeffiziente Welt arbeiten.💡🌍 #Energiezukunft #SmartCity Bis zum nächsten Update! 📈👋http://www.stromfee.graphics/images_sshot/leonardo_image_20250329_074854_1.png
Read moreEnergieeffizienz im Büro: Eine detaillierte Verbrauchsanalyse moderner Arbeitstechnologien
Views: 0### Energieverbrauchsanalyse: Einblick in die Datenvisualisierungen Hey Leute! 🌟 Heute werfen wir einen spannenden Blick auf die Energieverbrauchsmuster verschiedener Geräte in unserem Umfeld. Bleibt dran, um zu sehen, wie wir Energie effizienter nutzen können! 🖥 **Michelle’s PC**: Michelles PC ist ein echter Energiesparer! Mit einem maximalen Verbrauch von 176 W und einem Durchschnitt von 30,5 W zeigt es, wie optimiert unsere Geräte laufen können. Die sporadischen Spitzen? Vermutlich ein Zeichen für die gelegentliche Nutzung leistungshungriger Apps. #Effizienz 📺 **TV Studio**: Im Vergleich dazu benötigen unsere TV-Studios viel Power! Mit Spitzen bis zu 314 W beim TV Studio und 156 W beim Geck 3, sieht man deutlich, wie die Anforderungen während der Produktionen schwanken. #Medienpower 🏢 **Katharinas Büro**: Hier geht es oft heiß her! Mit einem Maximalverbrauch von 206 W und einem Schnitt bei 95,9 W sind intensive Nutzungsmuster klar erkennbar – besonders während besonderer Projekte. #Büroleben 🔊 **Audio & LED Geräte**: Diese kleinen Helfer sind super sparsam! Mit einem Maximalverbrauch von nur 33,4 W und einem Durchschnitt von 15,2 W bleibt der Energiebedarf hier immer schön konstant. #StabilUndSparsam 🖥️ **Grafik Displays**: Uups, hier gibt es leider keine Daten… Technisches Ooopsie oder ein Netzproblem? #DatenFehlen 🧮 **Maximaler PC-Verbrauch**: Auch andere PCs in unserem Büro zeigen mit einem maximalen Verbrauch von 166 W und einem Durchschnitt von 91,9 W, dass wir recht effizient arbeiten. #PCPower 📊 **Büro Gesamtlast**: Die Gesamtbilanz? Maximal 4,90 kW und durchschnittlich 1,33 kW. Ein paar Spitzen gibt es hier und da – ein Zeichen dafür, dass wir alle fleißig sind! #ArbeitsEifer 📑 **Zusammenfassung**: Unsere Analyse zeigt, dass jedes Gerät und jeder Arbeitsplatz ganz eigene Verbrauchsmuster hat. Während unsere Mediengeräte und PCs oft auf Hochtouren laufen, sind Geräte wie Audio und LEDs wahre Sparmeister. Es gibt noch viel zu tun, um unsere Effizienz weiter zu steigern. Lasst uns die Technik immer im Auge behalten! #ZusammenEffizienter Freut euch auf Updates, wie wir weiter daran arbeiten, unseren Energieverbrauch zu optimieren. Lasst uns gemeinsam energiebewusster werden! 💪 #EnergieZukunft Vielen Dank fürs Lesen und bleibt energiegeladen! 🌍✨http://www.stromfee.graphics/images_sshot/leonardo_image_20250508_191632_1.png
Read moreEnergieverbrauch im Büro: Eine detaillierte Analyse unserer Geräteeffizienz
Views: 0Hallo Zusammen! 🌟 Heute tauchen wir in die faszinierende Welt unseres Energieverbrauchs der letzten zwei Tage ein. Wir haben einige interessante Muster und Details entdeckt, die ich gerne mit euch teilen möchte! ✨ Zuerst zu Michelle: Ihr habt es vielleicht nicht gewusst, aber ihr Gerät schwingt zwischen 26.4 W im Durchschnitt und Spitzen von bis zu 147 W. Das klingt nach einigen spannenden Aktivitäten! 🚀 Keine Sorgen, alles sieht stabil aus, aber könnten wir noch effizienter sein? Lasst uns das mal im Auge behalten! Wechselt man in unser TV Studio, sieht das Ganze schon anders aus. Bei einer durchschnittlichen Last von 174 W und Spitzen bis zu 345 W wird klar, dass hier ordentlich was los ist, besonders bei Live-Events! 📺 Spannend, aber schauen wir, dass wir da keine Engpässe bekommen. In Katharinas Büro zeigt sich ein Mix aus Beständigkeit und gelegentlichen Verbrauchsspitzen mit max. 206 W und einem Schnitt von 94.2 W. Hier könnte effizientere Nutzung ein Thema sein. 📊 Ganz anders sieht es bei unserem Audio und LEDs PC aus: Nur 33.4 W am Maximum und bescheidene 12.1 W im Durchschnitt. Ein echter Sparmeister! 💡 Doch sollten wir vielleicht überlegen, ob hier ein Upgrade sinnvoll wäre. Ein bisschen mysteriös wird’s beim größten TV – hier fehlen Daten! Ein klarer Fall für unsere Tech-Detektive. 🕵️♀️ Und unser PC 3? Der nutzt stetig seine Energie mit Spitzen bei 166 W und einem Durchschnitt von 94.1 W. Effizienz scheint hier kein Fremdwort zu sein! In der Gesamtschau unseres Büros haben wir eine Gesamtlast von beeindruckenden 4.90 kW maximal und 1.32 kW im Durchschnitt. Wirkt, als wird’s hier nie langweilig! 🌍 Zusammengefasst, liebe Leute, unsere Analyse zeigt, dass wir ziemlich gut unterwegs sind, aber wie immer gibt es Raum für Verbesserungen. Lassen wir unsere Geräte nicht unnötig laufen und halten alles schön im Grünen Bereich. Lasst uns gemeinsam energiebewusst bleiben! Denkt dran, regelmäßiges Monitoring hilft uns, effizient und kostensparend zu bleiben. Auf eine grünere Zukunft! 🌱 #Energiesparen #SmartOffice #EffizienzBoost Danke, dass ihr dabei seid. Bleibt energiegeladen! ⚡http://www.stromfee.graphics/images_sshot/leonardo_image_20250508_131538_1.png
Read moreEnergieverbrauch im Wohnzimmer: Ein Fernseher-Check mit Überraschungen
Views: 0Hey Community! 📺⚡️✨ Wisst ihr, wie viel Energie euer Fernseher so im Schnitt verbraucht? Ich habe mal ein bisschen in den Daten gestöbert und dabei echt spannende Dinge entdeckt, die ich gerne mit euch teilen möchte! ### Fernseher-Check: Janko Wohnzimmer 🎉 Im Wohnzimmer ging’s am 02.01.2023 um 19:00 Uhr heiß her! Der Fernseher hat stolze 21.1 mW verbraucht – das ist der Spitzenwert! Um diese Uhrzeit und nochmal eine Stunde später habe ich einige Höhepunkte bemerkt. Könnte das der spannende Film-Abend gewesen sein oder doch das große Fußballspiel? 📺🍿 ### Fernseher-Check: Janko Fußballwinner ⚽️📉 Im Fußballzimmer sieht’s anders aus – hier wurde am gleichen Tag um 18:00 Uhr nur ein Verbrauch von 14.3 mW gemessen – entspannter Abend, huh? Im Vergleich zum Wohnzimmer bleibt der Verbrauch niedrig und gleichmäßig. Vielleicht nur eine kleine Fußballzusammenfassung geguckt? ### Was das alles bedeutet? 🤓 Zusammenfassend lässt sich sagen, dass das Wohnzimmergerät besonders in den Abendstunden viel ausgeprägter genutzt wird – hier tobt das Leben! Im Fußballzimmer ist es eher ruhig, was einen geringeren Energieverbrauch bedeutet. Diese kleinen Einblicke sind goldwert, wenn es darum geht, Energie effektiver einzusetzen und ein bisschen grüner zu leben. Schaut doch auch mal, wann eure Geräte am meisten schlucken und optimiert vielleicht eure Nutzung. Euer Geldbeutel und die Umwelt werden es euch danken! 🌍💚 Bleibt neugierig und bis zum nächsten Mal! #EnergieSpitzen #SmartHome #EnergieEffizienz #Nachhaltigkeithttp://www.stromfee.graphics/images_sshot/leonardo_image_20250509_200233_1.png Biogasanlage
Read moreEnergieverbrauch im Wohnzimmer: Wie unsere Fernseher Strom konsumieren
Views: 0Hallo zusammen! 🌟 Heute werfen wir einen Blick auf unseren Energieverbrauch und wie unsere geliebten Fernseher dabei eine Rolle spielen. Also, schnappt euch einen Kaffee und lasst uns gemeinsam durch die spannenden Details navigieren! 😊📺 ## Wohnzimmer-Glotze bei Janina Im gemütlichen Wohnzimmer von Janina sah das erste Diagramm folgendermaßen aus: Unsere Spitzenzeit für den Fernsehgenuss war um 19:30 Uhr mit einem Verbrauch von 12,5 mW – das ist die Prime-Time! Vielleicht lief ja eine spannende Serie? 🍿 Andererseits, während der stillen Morgenstunden um 08:00 Uhr, hat der Fernseher komplett Pause gemacht – Energieverbrauch: 0 mW. Da glänzt der Bildschirm durch Abwesenheit! ## Fußballzimmer – Heim für die großen Spiele Das zweite Diagramm führt uns ins aufregende Fußballzimmer! Hier erreichte der Energieverbrauch um 22:00 Uhr einen echten Höhepunkt mit 27,3 mW – sicherlich während eines packenden Spiels, oder? ⚽🏆 Auch hier, während der Ruhe der Nacht um 02:00 Uhr, zeigt der Verbrauch 0 mW. Alle schlafen, nur der Rasen ruht sich aus. ## Was sagen uns diese Zahlen? Zwischen Fernsehschauen und Energieverbrauch gibt es eine klare Verbindung – besonders abends steigt der Verbrauch enorm. Während Janinas Wohnzimmerfernseher eher bescheidenere Spitzen verzeichnet, scheint das Fußballzimmer der echte Energie-Champion zu sein. Diese Infos könnten Gold wert sein, wenn wir überlegen, wie wir unsere Energie noch cleverer nutzen können! 🌍💡 Verfolgt ihr auch euren Energieverbrauch, oder lässt euch das kalt? Lasst es uns wissen! Und denkt daran: Jede noch so kleine Anpassung hilft unserem Planeten. Bis zum nächsten Mal! 😃✨ #Energieverbrauch #SmartHome #Nachhaltigkeithttp://www.stromfee.graphics/images_sshot/leonardo_image_20250509_185802_1.png Smart Home Energie-Management
Read moreEnergie-Detektive: Die Stromgeheimnisse unserer Fernseher entschlüsselt 🕵️♀️⚡️
Views: 0**Energie mal anders betrachtet: Unsere TVs unter der Lupe! ⚡️📺** **1. Wohnzimmer-Glotze: Ein echter Stromfresser?** Unser geliebter Fernseher im Wohnzimmer bleibt mit seinem Energieverbrauch von 25 mW recht konstant, zeigt aber auch seine Launen! Besonders um 18:00 Uhr, wenn viele von uns es sich gerade gemütlich machen, zieht der gute alte Fernseher kurz mal mehr Strom. Stellt euch vor, genau dann läuft die Lieblingsserie – kein Wunder, oder? 🍿📺 **2. Fußballzimmer-Schirm: Der Sparsame in der Runde** Im Vergleich dazu ist der Fernseher im Fußballzimmer ein echter Sparfuchs mit einem Minimumverbrauch von 21,2 mW. Aber haltet euch fest – kurz vor 20:30 Uhr gibt es eine kleine Überraschung: eine Verbrauchsspitze! Klingt nach einem spannenden Fußballspiel, das dort übertragen wird, oder? ⚽🎉 **Was sagt uns das?** Die Analyse deckt ganz klar auf: Während unser Wohnzimmer-TV zur Prime Time um 18:00 Uhr gerne mal mehr schluckt, hat der Fernseher im Fußballzimmer seinen großen Auftritt meistens zur Sportprime-Time um 20:30 Uhr. Diese kleinen Einblicke in unsere TV-Gewohnheiten sind nicht nur super interessant, sondern zeigen auch, wie unser Verhalten den Energieverbrauch beeinflusst! Faszinierend, wie ein kleines bisschen Alltagsbeobachtung uns helfen kann, smarter mit Energie umzugehen, oder? Lasst uns diese Insights nutzen, um bewusster zu werden! 💡🌍 #Energieeffizienz #SmartHome #Nachhaltigkeit #Fernsehzeithttp://www.stromfee.graphics/images_sshot/leonardo_image_20250509_175736_1.png Smart Home Energie-Management
Read moreBüro-Power-Check: Unsere Geräte und ihre Energie-Performance 🔌⚡
Views: 0Hey Leute! 🌟 Heute werfen wir einen lockeren Blick auf die Leistungsdaten unserer PCs und Geräte – spannend verpackt, versprochen! 😊 **1. Michelles PC-Packstation** Unser kleines Powerhouse Michelle zeigt mit einer maximalen Leistung von beeindruckenden 147 Watt auf, tanzt im Schnitt aber auf leisen 26,4 Watt. Stabil und effizient – Michelle, du bist ein Vorbild! 👏 #EnergieEffizienz **2. TV Studio – der Power-Player!** Wow, bis zu 345 Watt zieht das TV Studio am Limit und hält sich meist bei aufregenden 172 Watt. Klar, dass hier die Action stattfindet, oder? Die Lastspitzen sprechen für sich. 📺 #TVStudioPower **3. Katharinas Büro – flexibel und fleißig** Katharinas Büro-PC liefert mal ruhige, mal stürmische 206 Watt, pendelt sich aber bei 93,8 Watt ein. Besonders abends geht hier die Post ab! 🌙✨ #BüroHeld **4. Audio und LEDs – Der Leise im Hintergrund** Ein echter Minimalist: 33,4 Watt am Limit und durchschnittlich nur 12 Watt Verbrauch zeigen, dass man auch leise Großes bewirken kann! 💡🔊 #LeiseStärke **5. PC 3 – Der Beständige** Mit maximal 166 Watt und im Schnitt 94,1 Watt zeigt PC 3, wie man solide Leistung konstant hält. Nur manchmal gibt’s einen kleinen Kraftschub! 💪 #StabileLeistung **6. Gesamtbüro – das Herz unserer Arbeit** Von 1,32 kW bis zu energiegeladenen 4,90 kW reicht unsere Büroudynamik. Wie viele von uns gerade an heißen Projekten arbeiten, sieht man am Stromverbrauch! ⚡👥 #TeamPower **7. 19 Zoll LCD – Das Mysterium** Huch, keine Daten? Scheint, als hätte unser kleiner LCD Bildschirm eine kreative Pause eingelegt. 😉 #MysteriumLCD Jungs, Mädels, wie sieht’s bei euch aus? Wer hat den sparsamsten oder energiegeladensten Arbeitsplatz? Teilt eure Gedanken! 😄👇 #EnergieSparMeister #TechnikCheckhttp://www.stromfee.graphics/images_sshot/leonardo_image_20250508_011616_1.png
Read moreStromverbrauch von Fernsehern: Ein Detaillierter Einblick in Energiemuster und Effizienz
Views: 0Hey, liebe Community! 🌟 Heute werfen wir mal einen Blick auf etwas, das uns alle betrifft: den Energieverbrauch unserer geliebten Fernseher.📺 **1. Was uns das obere Diagramm über unseren TV verrät** Habt ihr euch jemals gefragt, wie viel Strom euer Fernseher verbraucht, wenn ihr eure Lieblingsserie schaut? Das erste Diagramm zeigt genau dies. Stellt euch vor, zu einem bestimmten Zeitpunkt schoss der Verbrauch auf X Watt hoch! Und ja, das war der Spitzenwert. Auf der anderen Seite gab es auch Momente, in denen der Fernseher gar keinen Strom verbrauchte – also komplett aus war. Wer hätte das gedacht? 🔌📉 **2. Ein Blick auf das untere Diagramm: Fernseher Janina** Nun zu einem anderen Fernsehmodell, liebevoll ‘Fernseher Janina’ genannt. Hier spitzte sich der Stromverbrauch auf 23.1 mW zu und trat genau um A Uhr auf. Ob da wohl jemand noch eine Late-Night-Show geschaut hat? 😉 Und ja, auch hier gab es Zeiten der Nullnutzung. Scheint, als hätte auch Janina ihre Pausen gebraucht! **3. Was wir daraus lernen können** Die Trends sind eindeutig: Unsere Fernseher mögen es offensichtlich, in den Abendstunden zu glänzen. 🌙✨ Beide Geräte zeigten erhöhte Werte während aktiver Szenarien und obwohl ‘Fernseher Janina’ etwas zurückhaltender war, blieben die Werte überwiegend konstant. Solche Infos könnten uns helfen, unseren Stromverbrauch besser zu steuern und bewusster mit unseren Geräten umzugehen. Danke, dass ihr euch die Zeit genommen habt! Teilt eure Gedanken dazu und lasst uns gemeinsam energiebewusster werden! 🌍💡 #EnergieVerbrauch #SmartHome #Nachhaltigkeit #TechTalkhttp://www.stromfee.graphics/images_sshot/leonardo_image_20250509_155746_1.png Smart Home Energie-Management
Read moreEnergieverbrauch entschlüsselt: Wohnraum vs. Sportler – Eine spannende Analyse 🌟
Views: 0# Energieverbrauchsanalyse: Ein spannender Datenblick! 🌟 ## Wohnraum im Fokus 🏠 Hast du dich schon mal gefragt, wie der Energieverbrauch in deinem Zuhause aussieht? Unser erstes Diagramm verrät es! Besonders interessant: Abends zwischen 20:00 und 21:00 Uhr geht’s richtig rund – da schnellt der Verbrauch in die Höhe! 📈 Vermutlich, weil wir dann gerne all unsere Lieblingsgeräte gleichzeitig nutzen. Wer kennt’s nicht? ## Der Sportler unter den Stromverbrauchern ⚽ Jetzt zum etwas anderen Diagramm: der Energieverbrauch eines Fußballspielers. Hier bleibt alles schön gleichmäßig, außer kleinen Ausreißern bei den Spielen um 15:00 und 18:00 Uhr. Da zeigt jemand echte Ausdauer! ## Was wir lernen können 🧐 Also, was sagen uns diese spannenden Insights? Im Wohnbereich gibt’s große Sprünge im Energieverbrauch, ganz klar ein Hinweis darauf, dass wir manchmal alle Geräte auf einmal anschalten. Ein kleiner Tipp: Vielleicht lässt sich da ja etwas optimieren und Energie sparen? 🌍💡 Im Vergleich dazu ist der Fußballer ein Musterbeispiel für konstanten Energieverbrauch – das können wir uns als Vorbild nehmen! Lasst uns die Energienutzung clever angehen! Welche Tipps habt ihr für die Energieoptimierung daheim? Teilt eure Ideen! 🤗 #Energieeffizienz #SmartHome #Nachhaltigkeit #Energiesparenhttp://www.stromfee.graphics/images_sshot/leonardo_image_20250509_145742_1.png Smart Home Energie-Management
Read moreNachtschwärmer und Primetime: Eine energetische Reise durch unsere Fernseher
Views: 0**Energieverbrauchsanalyse: Ein spannender Einblick!** **Schlummermodus oder Serienmarathon? 📺** Wer hätte gedacht, dass unser Schlafzimmerfernseher so ein Nachtaktiver ist? Mit einem Spitzenverbrauch von 14,3 mW zeigt uns die Statistik, dass besonders um 02:00 Uhr und 04:00 Uhr die Energieverbrauchskurve einen kleinen Sprung macht. Da ist wohl jemand nicht ganz im Tiefschlaf, oder wie? Zwischen 03:00 Uhr und 04:00 Uhr haben wir fast nichts auf dem Energie-Radar, ganz geheimnisvoll! 🌜 **Wohnzimmer-Entertainment auf Hochtouren 🎬** Im Wohnzimmer geht es deutlich lebendiger zu! Hier erreicht der Fernseher um 20:00 Uhr und 22:00 Uhr mit bis zu 32,1 mW seinen Höhepunkt – Prime Time eben! Coolerweise gibt’s schon um 18:30 Uhr eine kleine Vorschau mit einem Sprung auf 10 mW. Solche Momente zeigen, dass es nicht nur um die Uhrzeit, sondern auch um die Show geht, die gerade läuft. 🍿 **Was wir gelernt haben 🔍** Zusammengefasst sehen wir, dass unser Wohnzimmer mit 32,1 mW den Spitzenplatz einnimmt, während das Schlafzimmer mit seinen bescheidenen 14,3 mW eher gemütlich bleibt. Die kleinen Verbrauchsspitzen hier und da? Ein deutliches Zeichen, dass in unseren vier Wänden immer etwas los ist. Bin ich der einzige, der jetzt neugierig ist, welche Shows diese Spitzen verursachen? 😄 Ob am Tag oder in der Nacht, unsere Fernseher haben ganz schön was zu erzählen. Ein toller Einblick, oder? Was denkt ihr? Teilt eure Meinungen und bleibt energiebewusst! #EnergieAnalyse #SmartHome #EnergieSparen Viel Spaß beim Diskutieren und bis zum nächsten spannenden Energie-Update!http://www.stromfee.graphics/images_sshot/leonardo_image_20250509_135741_1.png Smart Home Energie-Management
Read moreEnergieverbrauch entschlüsselt: Wie Alltagsgeräte heimlich Strom schlucken
Views: 0Hey liebe Energie-Sparfüchse! 🌍⚡️ Habt ihr euch jemals gefragt, wie eure Geräte so im Laufe der Zeit Strom schlucken? Ich hab mir mal die Mühe gemacht, ein paar spannende Daten zu analysieren, und möchte euch meine Entdeckungen nicht vorenthalten! 😊 ### Erster Chart: Der geheimnisvolle Fernseher! 📺 Das erste Diagramm hat eine echte Überraschung parat! Anfangs zeigt der Fernseher einen Verbrauch von 0 Watt – sieht so aus, als wäre er ausgeschaltet. Aber haltet euch fest: Plötzlich schießt der Verbrauch nach oben! Scheint, als hätte jemand nicht widerstehen können und musste die neueste Folge seiner Lieblingsserie schauen. 🍿 ### Zweiter Chart: Das Rätsel des Dauerläufers! 🔋 Jetzt zum zweiten Gerät: Hier sehen wir einen konstanten Verbrauch von nur 21,7 mW. Das ist ziemlich niedrig, also wahrscheinlich ist das Gerät im Standby-Modus. Super, dass es so gleichmäßig läuft – das deutet auf eine sehr effiziente Nutzung hin. ### Was lernen wir daraus? Diese Diagramme sind super hilfreich, um zu verstehen, wie wir unsere Geräte nutzen. Der TV mit seinen Spitzen zeigt, dass wir Strom sparen könnten, indem wir ihn wirklich nur einschalten, wenn wir ihn auch benutzen. Das andere Gerät ist ein tolles Beispiel für Energieeffizienz im Standby. 🌟 Es lohnt sich wirklich, solche Analysen regelmäßig durchzuführen. So entdecken wir vielleicht noch mehr Möglichkeiten, wie wir clever Strom sparen können! Wie steht’s bei euch? Welches Gerät leistet bei euch unermüdlich seinen Dienst, und wo seht ihr Sparpotenzial? Teilt eure Stories und lasst uns gemeinsam smartere Energiegewohnheiten entwickeln! #EnergieSparen #SmartHome #Nachhaltigkeit #Energieeffizienz 😃👍 Freue mich auf eure Kommentare und eure eigenen Erfahrungen! Euer [DeinName]http://www.stromfee.graphics/images_sshot/leonardo_image_20250509_125750_1.png Smart Home Energie-Management
Read moreEnergy Detective: Wer verbraucht wie viel Strom? 🔍⚡
Views: 0🌟 **Energieverbrauchsanalyse: Spitzenwerte und Sparmeister!** 🌟 Hey zusammen! 🎉 Wisst ihr, welcher Fernseher am meisten Energie zieht, wenn’s spannend wird? Taucht ein in unsere kleine Energie-Studie! 📊📺 ### 1. **Fernseher: Janko Wohnheimer** Janko’s TV ist ja eher der entspannte Typ: mit moderate Schwankungen im Verbrauch, aber passt auf – am 03.01. um 18:00 Uhr sprang der Verbrauch kurz hoch. Vielleicht eine spannende Serie? 😲📈 ### 2. **Fernseher: Janina Fußballwinner** Bei Janina steigt die Spannung – und der Energieverbrauch! Ganze 16,7 mW zeigte der Fernseher beim letzten Spiel. Am 03.01. um 18:15 Uhr explodierte der Verbrauch, sicher ein Tor! ⚽️🎉 ### **Zusammenfassung der Erkenntnisse** Jetzt wird’s interessant: Janko’s TV ist recht genügsam, außer bei gelegentlichen Ausreißern. Janinas Fernseher machts genau andersrum – regelmäßig hoher Verbrauch bei Sportevents! Ob Fußball oder Filmabend, am 03.01. waren beide Fernseher auf Hochtouren. Wer spart, guckt nachts! 🌙✨ Lasst uns wissen, wie eure Geräte so laufen und teilt eure Energiespartipps! Habt ihr ähnliche Erfahrungen gemacht? 😃 #EnergieSparen #TechnikTrends #Nachhaltigkeit — Durch diesen kleinen Einblick in den Energieverbrauch könnten wir alle ein bisschen bewusster mit unserer Energie umgehen! Danke fürs Lesen & teilt gerne eure Gedanken! 💡🌿http://www.stromfee.graphics/images_sshot/leonardo_image_20250509_115741_1.png Smart Home Energie-Management
Read moreEnergy-Effizienz im Heimkino: Wie viel Strom verbrauchen unsere Fernseher? 📺⚡
Views: 0### Eure Energie-Checkliste fürs Heimkino 📺✨ Hallo Ihr Lieben, wisst ihr, wie viel Strom euer Fernseher eigentlich verbraucht? Nun, ich habe da mal ein bisschen Licht ins Dunkel gebracht und möchte euch heute von meinen kleinen Entdeckungsreisen bei zwei ganz besonderen Fernsehmodellen berichten. 🌟 **1. TV-Fernseher Janko Wohnen** Der „Janko Wohnen” ist wirklich ein fleißiges Kerlchen. Am 1. August um genau 18:00 Uhr hat er mit 12.5 mW seinen Spitzenverbrauch erreicht! 📈 Ganz schön energiegeladen, oder? Aber keine Sorge, er weiß auch, wann es Zeit ist, eine Pause einzulegen und schaltet dann auf minimalen Energieverbrauch um. 🌟 **2. TV-Fernseher Janina Fußballwinner** Jetzt haltet euch fest: Unser „Janina Fußballwinner” bringt es sogar auf stolze 22.7 mW und das ebenfalls um 18:00 Uhr am 2. August! ⚽💡 Diese Taktik zeigt, dass er besonders in den Abendstunden beim Fußballschauen in Hochform ist. Doch auch er mag seine Ruhezeiten, die er zwischen Mitternacht und dem frühen Morgen findet. ### Was wir daraus lernen? 🤓 Die Unterschiede im Energieverbrauch sind nicht zu übersehen. Der „Janina Fußballwinner” braucht deutlich mehr Power als der „Janko Wohnen”. Beide zeigen aber auch, dass sie ihre Ruhephasen ernst nehmen. Dies könnte uns einen kleinen Hinweis geben, unsere Geräte gezielter zu nutzen und vielleicht auch mal ganz abzuschalten, wenn wir sie nicht brauchen. Es geht schließlich nicht nur darum, zu wissen, wann unsere Fernseher die meiste Energie verbrauchen, sondern auch darum, wie wir diese Infos nutzen, um ein wenig energiebewusster zu handeln. 🌍💚 Schaltet also nicht nur eure Fernseher, sondern auch mal den Stromsparmodus ein! #EnergieSparen #Heimkino #SmartHome #Nachhaltigkeithttp://www.stromfee.graphics/images_sshot/leonardo_image_20250509_105742_1.png Smart Home Energie-Management
Read moreEnergieverbrauchsanalyse im Büro und Studio: Geräte, Verbrauch und Effizienz
Views: 0**Energieverbrauchsanalyse: Ein Blick auf die Einzelgeräte** Hallo zusammen! Heute werfen wir einen spannenden Blick auf den Energieverbrauch unserer Geräte im Büro und im Studio. Lasst uns gemeinsam entdecken, wie wir effizienter arbeiten können! **Michelle PC** Unser Michelle PC ist ein echtes Kraftpaket! Er erreicht Spitzenwerte von bis zu 147 W, liegt aber im Durchschnitt bei gemütlichen 26,5 W. Scheint, als würde er nur dann so richtig aufdrehen, wenn es nötig ist. Interessant, oder? 🌟 **TV Studio** Im TV Studio geht’s oft heiß her! Mit einer maximalen Leistung von 345 W und einem Durchschnitt von 171 W zeigt sich, dass hier besonders in bestimmten Zeiten viel Energie benötigt wird. Ein Hinweis für uns, vielleicht genau dann ein Auge auf den Stromverbrauch zu werfen. 📺⚡ **Katharina Büro** Auch Katharinas PC zeigt sich flexibel: Mit Spitzen bis 206 W und einem Schnitt bei 94,1 W. Diese Schwankungen könnten spannende Geschichten über Katharinas Arbeitsalltag erzählen! 💻 **Audio und LEDs PC** Unser Audio- und LEDs-Setup ist der Musterschüler in Sachen Energieverbrauch: Maximal 33,4 W und durchschnittlich 12,1 W. Ein High-Five für die Effizienz! 👏 **Großferseher** Momentan haben wir keine Daten für unseren Großferseher – da scheint etwas Detektivarbeit nötig zu sein! 🔍 **Maximal Strom PC** Der Name ist hier Programm: Der Maximal Strom PC zeigt mit 166 W Spitze und 94,1 W im Schnitt, dass er gerne mal ins Schwitzen kommt. Vielleicht arbeitet hier jemand an großen Projekten? 🌐 **Büro Gesamtladen** Unser Büro Gesamtladen zeigt, dass wir im Schnitt recht sparsam sind, nur manchmal gibt’s Ausschläge bis zu 4,90 W. Klingt nach Raum für Optimierungen und vielleicht ein paar Energie-Spaßideen! 💡 **Zusammenfassung** Diese kleine Reise durch die Welt des Stroms zeigt, wie unterschiedlich unsere Geräte ticken. Lasst uns diese Infos nutzen, um noch smarter zu arbeiten und gemeinsam Energie zu sparen! 🌍💚 Habt ihr auch schon mal euren Energieverbrauch unter die Lupe genommen? Teilt eure Erfahrungen und Ideen! #EnergieEffizienz #SmartOffice #TechInsights — Diese Zusammenfassung bietet euch hoffentlich einige nützliche Einblicke und regt dazu an, über den eigenen Energieverbrauch nachzudenken. Lasst uns gemeinsam effizienter werden!http://www.stromfee.graphics/images_sshot/leonardo_image_20250507_191625_1.png
Read more