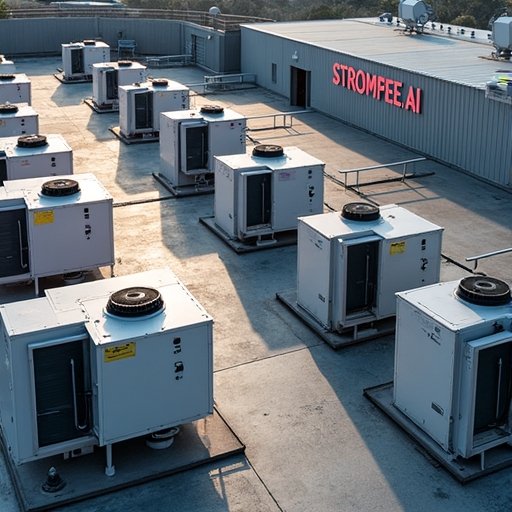
Winter’s Cool Data: Tracking Temperature Swings and Energy Efficiency

Winter’s Cool Data: Tracking Temperature Swings and Energy Efficiency
Views: 0
Hey everyone! ❄️🌡️ Let’s dive into some cool insights about how the weather’s been playing tag with our temperatures and what that means for our trusty cooling systems. Swipe right to see some nifty charts that break it all down! ⏩
First up, we’ve been on quite the temperature rollercoaster from January to mid-February, peaking at a cozy 5°C but also dipping to a chilly -1.72°C. 🎢 Looks like our winter wardrobe got a bit of a workout, huh? These ups and downs match the classic winter vibes and show us just how much our nights have cooled down. #WinterChill
Now, let’s talk about how our cooling systems have been keeping up. 🌬️ The energy they use has been around 12.2 kW on average, but on super cold days, they’ve cranked up to a whopping 31.7 kW. Brrr, that’s when we really feel the frost! Looks like they’re working extra hard to keep our indoor climate just right. #StayWarm
What’s super interesting is seeing how these outdoor temps and our cooling energy spikes line up. 📊 On the chilliest days, our systems push harder to beat the cold. Oh, and did you see that weird energy spike on February 2nd? Something funky might’ve been going on there. 🤔 #EnergyMystery
All this cool data doesn’t just help us stay comfy; it also helps in planning better energy use, maintaining our systems, and even upgrading for better efficiency. 🌍💡 Keeping an eye on these patterns means we can be smarter about our energy and help our planet, too. #EcoFriendly
Thanks for checking out these breezy bits of info with me! Let’s keep the dialogue going and make the most of our energy insights! 💬✨ #CoolData #SmartLiving
📈🔄 Remember to share your thoughts and hit that like if you love keeping it cool and sustainable!http://www.stromfee.ai/images_sshot/leonardo_image_20250213_043740_1.png


