Stromfee
Temperature Trends: How Weather Swings Impact Home Energy Efficiency
17. Feb. 2025
Stromfee
Energy Efficiency Insights: A Detailed Analysis of Our Hotel's Electricity Consumption
17. Feb. 2025
Stromfee
Schwankungen im Stromnetz: Kleine Änderungen mit großer Wirkung
17. Feb. 2025
Stromfee
Energy Insights: How Winter's Temperature Dance Impacts Your Home's Power Consumption
17. Feb. 2025
Stromfee
Stromnetzdynamik entschlüsselt: Eine Reise durch Frequenz und Spannung
17. Feb. 2025
Stromfee
Riding the Temperature Wave: Smart Energy Efficiency Insights Revealed!
17. Feb. 2025
Stromfee
Energy Insights: Decoding Heat Pump Performance and Temperature Trends
17. Feb. 2025
Stromfee
Smart Energy Management: Transforming Hotel Efficiency with Stromfee AI
17. Feb. 2025
Stromfee
Data Dynamics: Insights into Network Frequency and Voltage Fluctuations
17. Feb. 2025
Stromfee
Decoding Energy Consumption: How Temperature Swings Impact Power Usage
17. Feb. 2025
Stromfee
Energy Insights: How Stromfee Hotels Balances Comfort and Sustainability
17. Feb. 2025
Stromfee
Netzfrequenz und Spannungsdynamiken: Eine technische Analyse der Stromnetzvariabilität
17. Feb. 2025
Stromfee
Temperature and Power Dynamics: Unveiling Energy Consumption Patterns in Fluctuating Weather Conditions
17. Feb. 2025
Stromfee
The Stromfee AI Cooling Report: Revolutionizing Hotel Energy Efficiency with Smart Technology
17. Feb. 2025
Stromfee
Energy Efficiency Unveiled: A Comprehensive Look at Hotel Power Dynamics and Sustainable Solutions
17. Feb. 2025
Stromfee
Stromversorgung entschlüsselt: Die Achterbahn der Netzfrequenz und Spannung
17. Feb. 2025
Stromfee
Energienetz decoded: Die spannende Welt der mHz und Volt entdeckt!
17. Feb. 2025
Stromfee
Temperature Tango: Unraveling Cooling Energy Mysteries in Bündel
17. Feb. 2025
Stromfee
Die "neue Normalität" der Energiepreise – Und wie Sie sie zu Ihrem Vorteil nutzen
12. Nov. 2025
Stromfee
Strommarkt vor einem Paradigmenwechsel: Statt Stundenpreisen gibt es künftig 96 Preissignale am Tag
2. Nov. 2025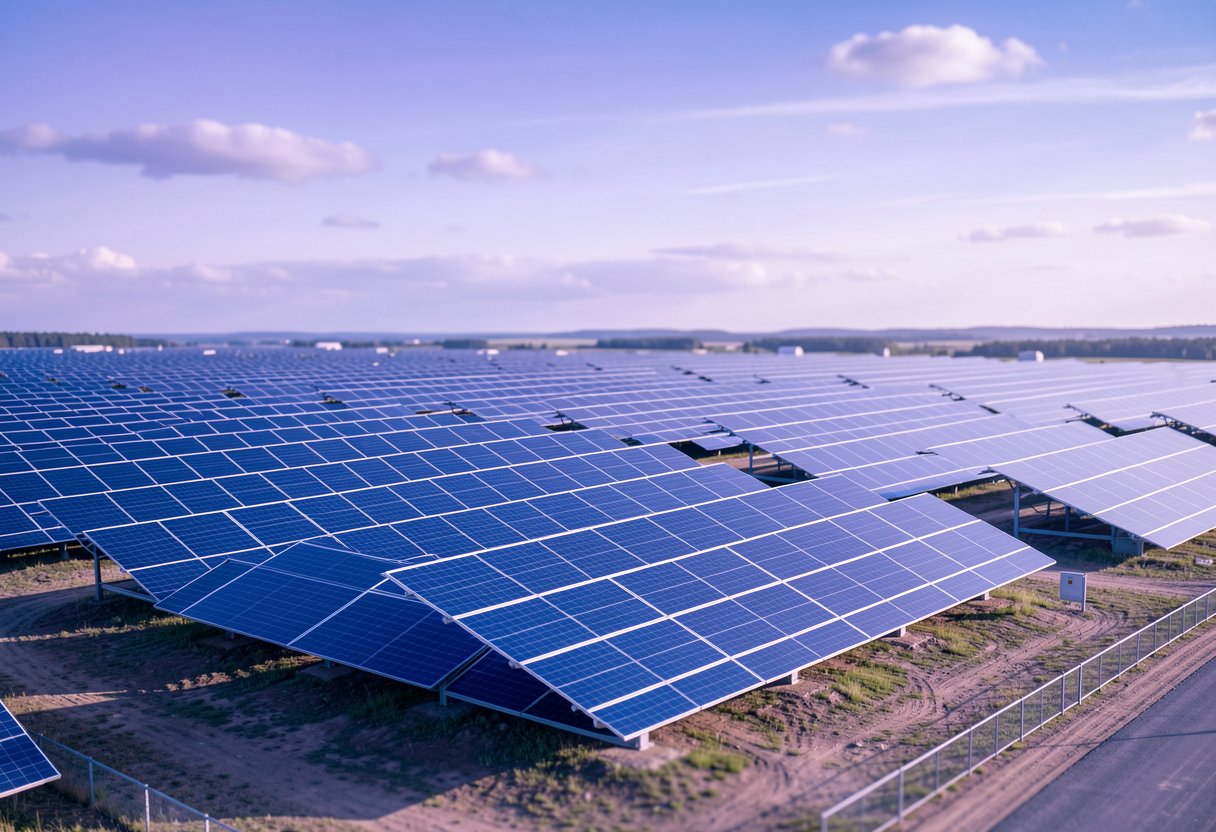
Stromfee
Solarpower im Detail: Die beeindruckenden Leistungsdaten unserer 664-kW-Photovoltaikanlage
5. Aug. 2025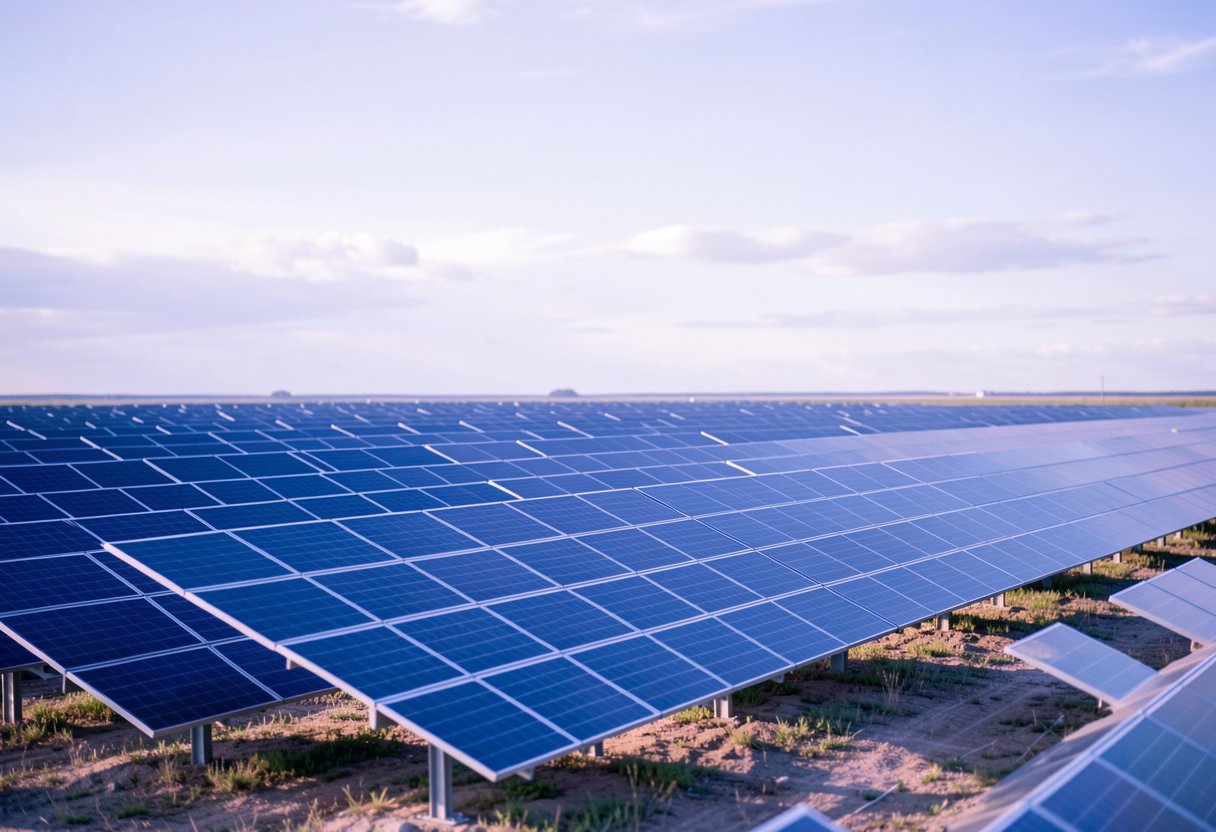
Stromfee
Energieanalyse: Leistungsbilanz unserer 1000-kWp-Photovoltaikanlage
4. Aug. 2025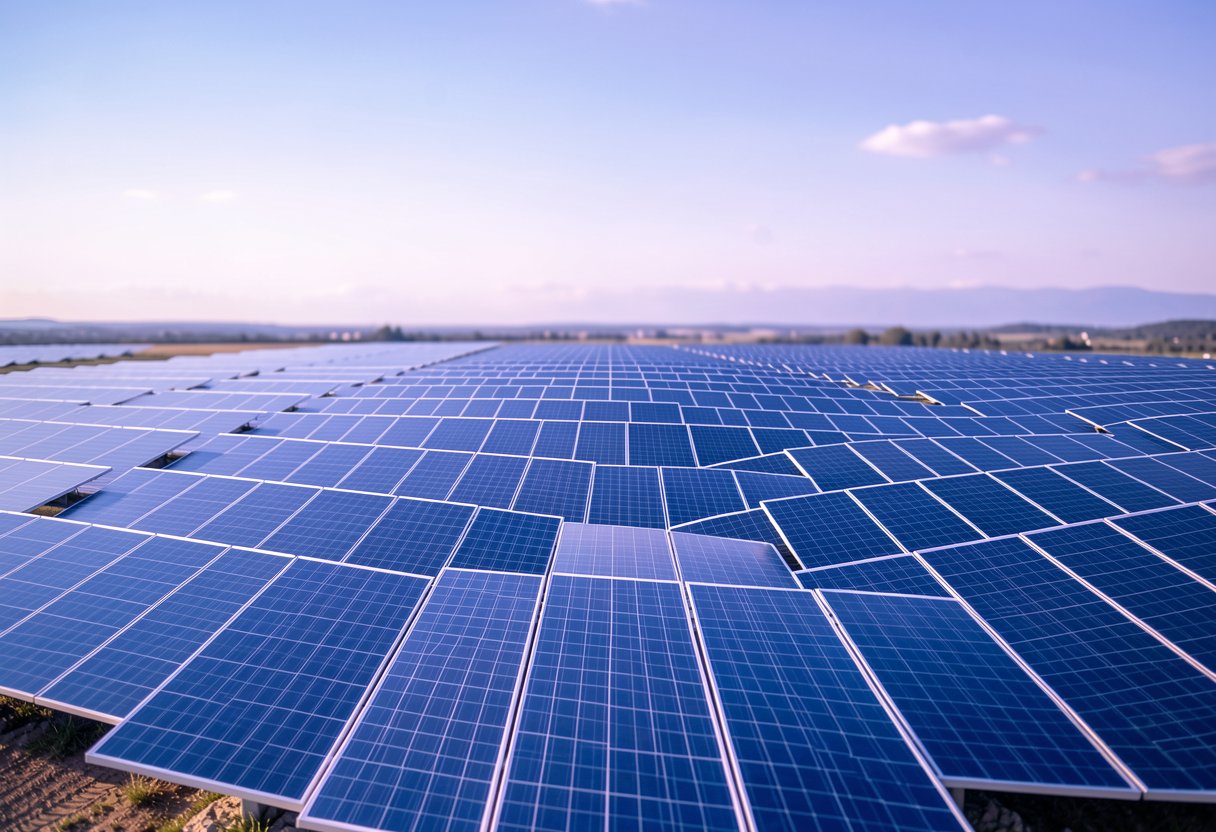
Stromfee
Sonnenpower im Detail: Leistungsdaten und Effizienz unserer PV-Anlage
3. Aug. 2025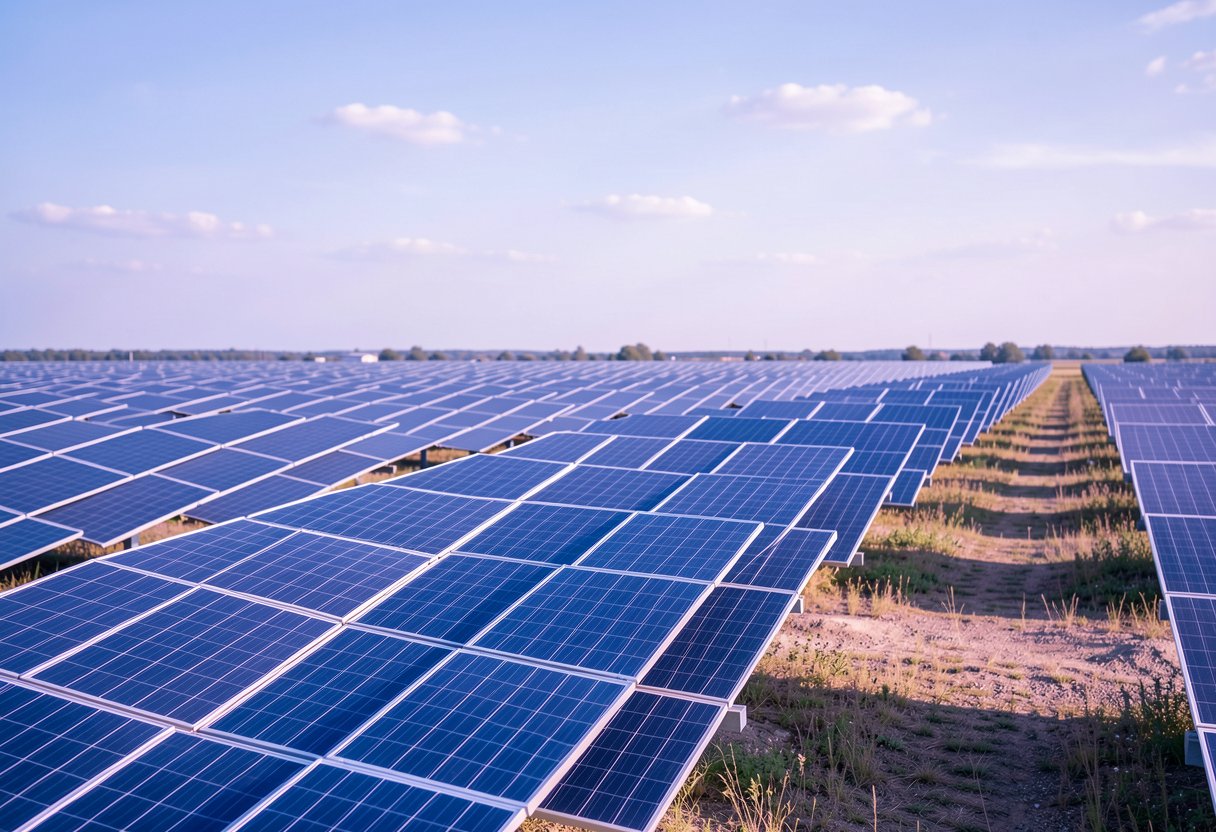
Stromfee