
Stromfee
Die "neue Normalität" der Energiepreise – Und wie Sie sie zu Ihrem Vorteil nutzen
12. Nov. 2025
Stromfee
Strommarkt vor einem Paradigmenwechsel: Statt Stundenpreisen gibt es künftig 96 Preissignale am Tag
2. Nov. 2025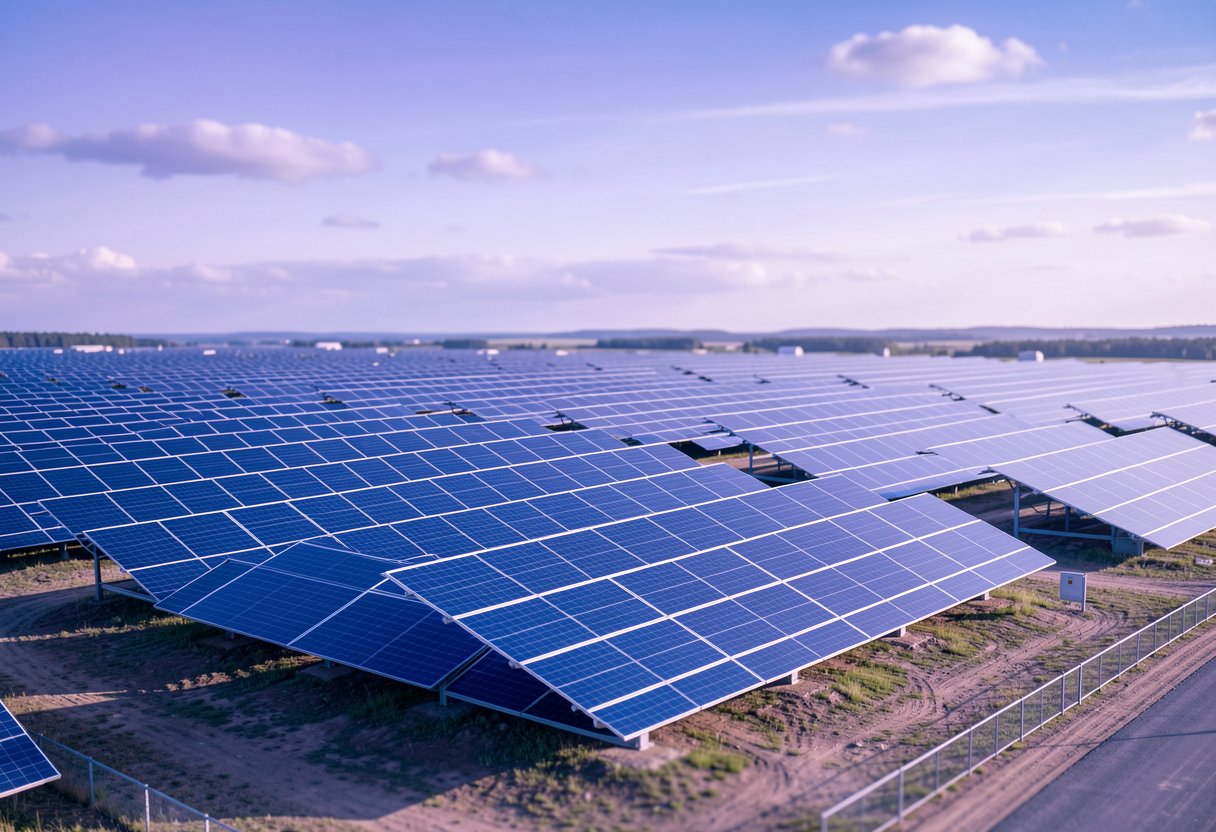
Stromfee
Solarpower im Detail: Die beeindruckenden Leistungsdaten unserer 664-kW-Photovoltaikanlage
5. Aug. 2025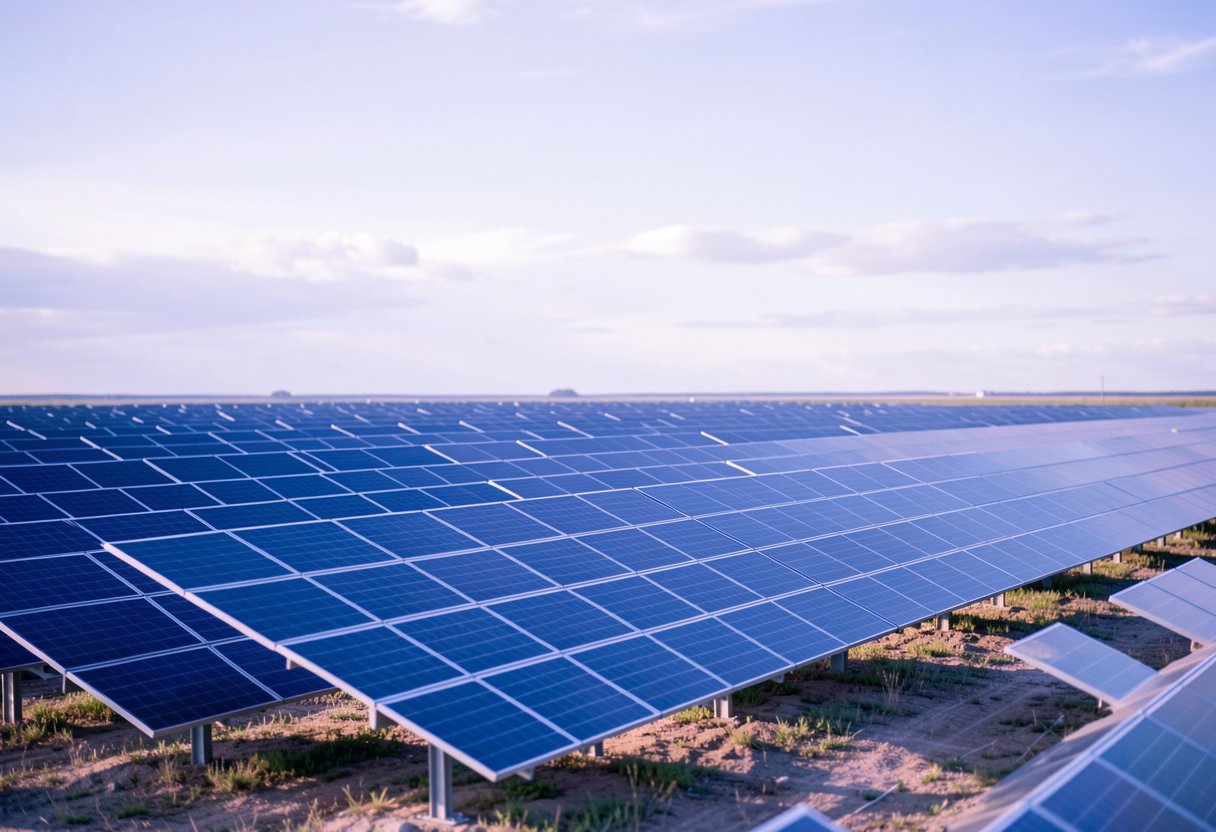
Stromfee
Energieanalyse: Leistungsbilanz unserer 1000-kWp-Photovoltaikanlage
4. Aug. 2025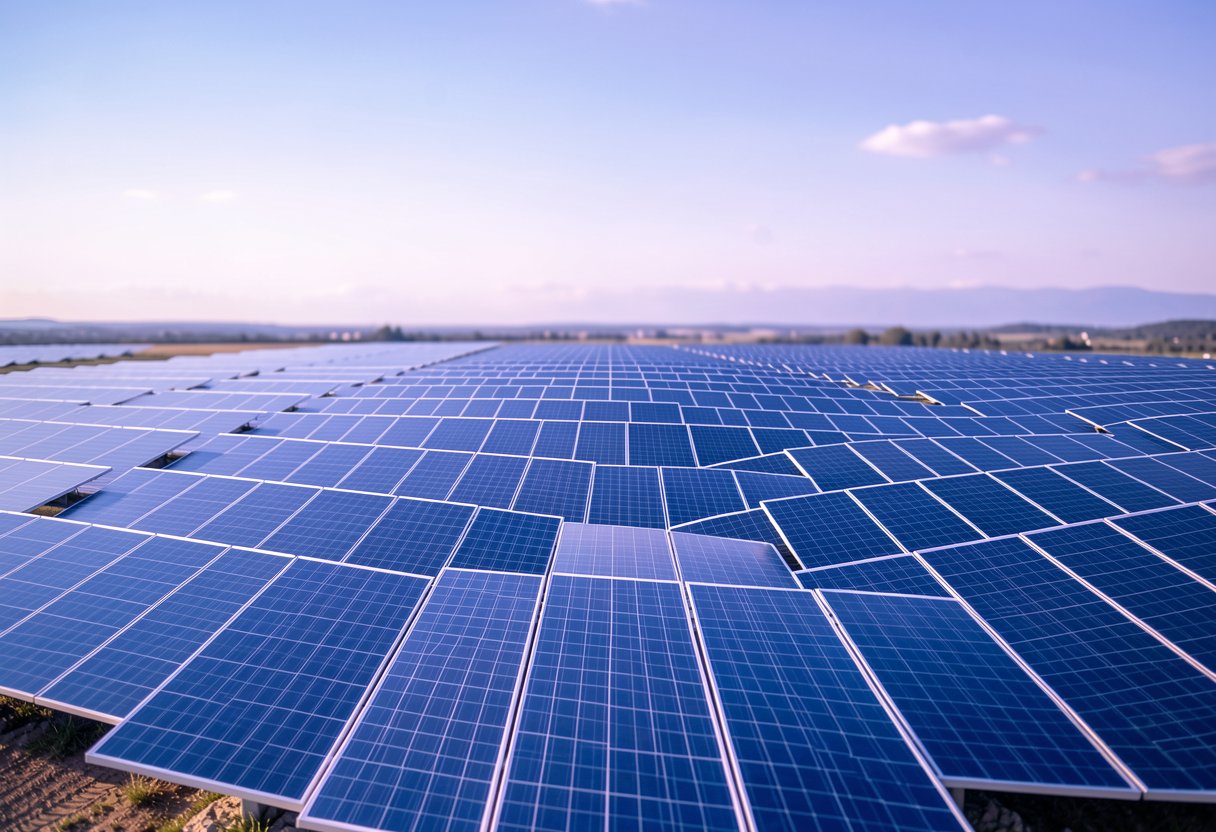
Stromfee
Sonnenpower im Detail: Leistungsdaten und Effizienz unserer PV-Anlage
3. Aug. 2025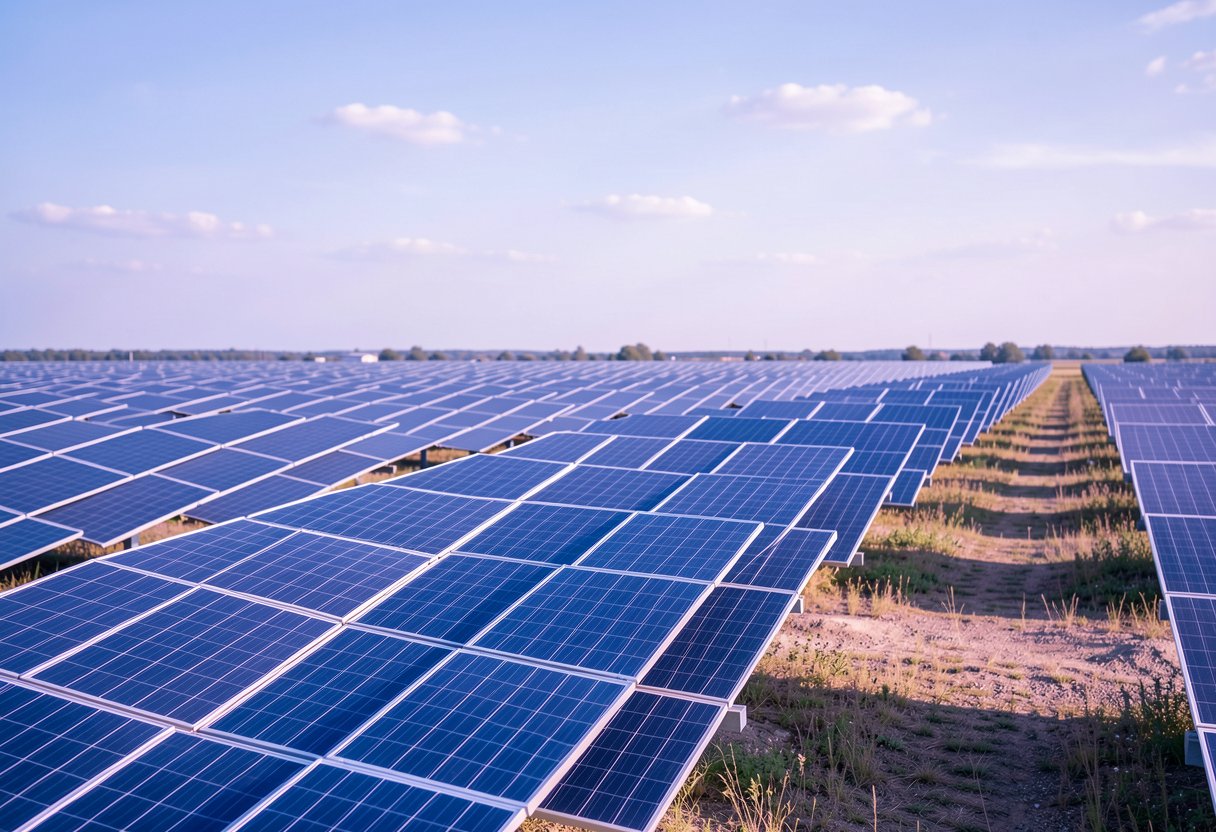
Stromfee
Sonnenernte im Überblick: Unsere PV-Anlage auf Höchstleistung
2. Aug. 2025
Stromfee
Betriebsdaten-Update: Leistung und Stabilität unserer 1000 kWp Solaranlage
1. Aug. 2025
Stromfee
PV-Anlage im Überblick: Leistung, Stabilität und Optimierungspotenzial
31. Juli 2025
Stromfee
Die 1000 kWp PV-Anlage: Leistung und Effizienz im Sonnenlicht
30. Juli 2025
Stromfee
Sonnenkraft im Überblick: Leistungsdaten unserer PV-Anlage
29. Juli 2025
Stromfee
Leistungsbericht: Unsere 1000 kWp PV-Anlage zeigt beeindruckende Ergebnisse
27. Juli 2025
Stromfee
Leistungsanalyse und Betriebswerte unserer PV-Anlage: Ein Einblick in die energetische Performance
26. Juli 2025
Stromfee
Sonnenenergie in Zahlen: Die Leistungsdaten unserer 1000 kWp PV-Anlage im Detail
25. Juli 2025
Stromfee
Technische Leistungsübersicht: Stabil und effizient - Unsere PV-Anlage im Fokus
24. Juli 2025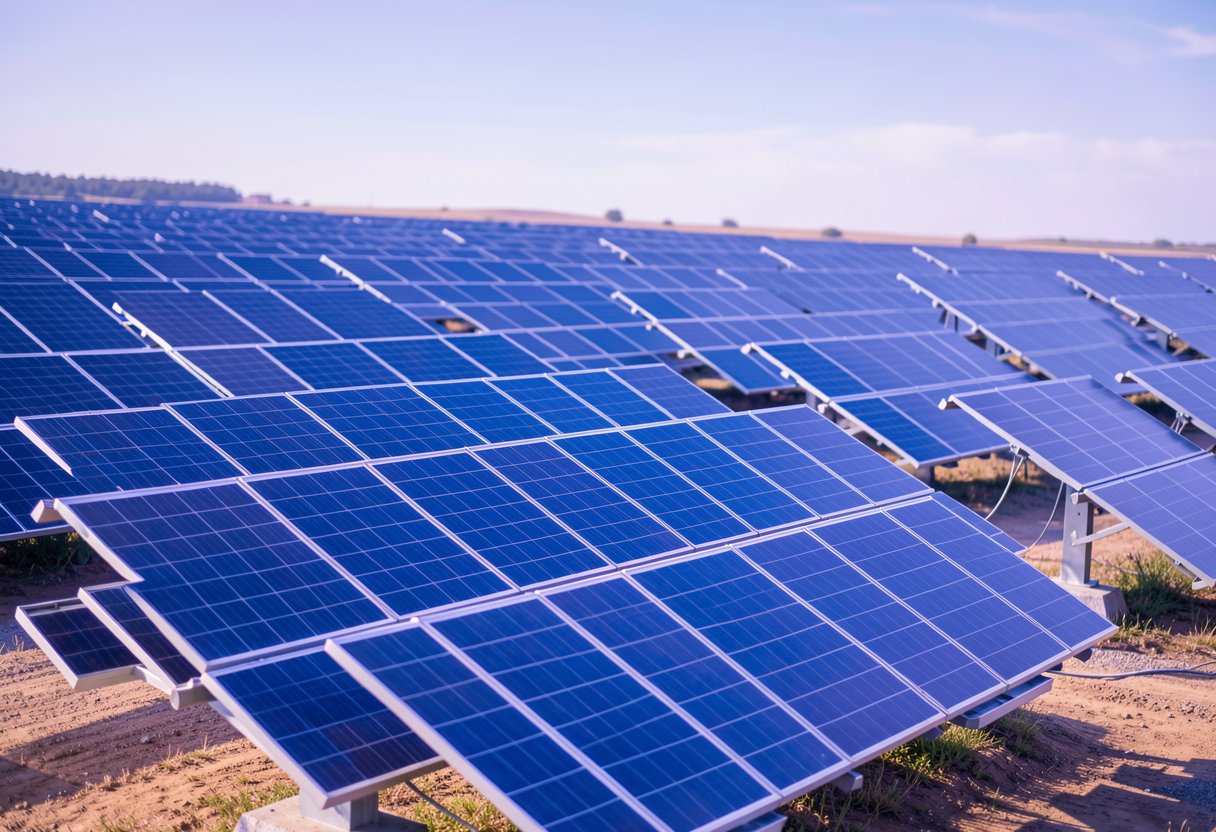
Stromfee
Spitzenwerte und Effizienz: Ein Blick auf unsere PV-Anlage
22. Juli 2025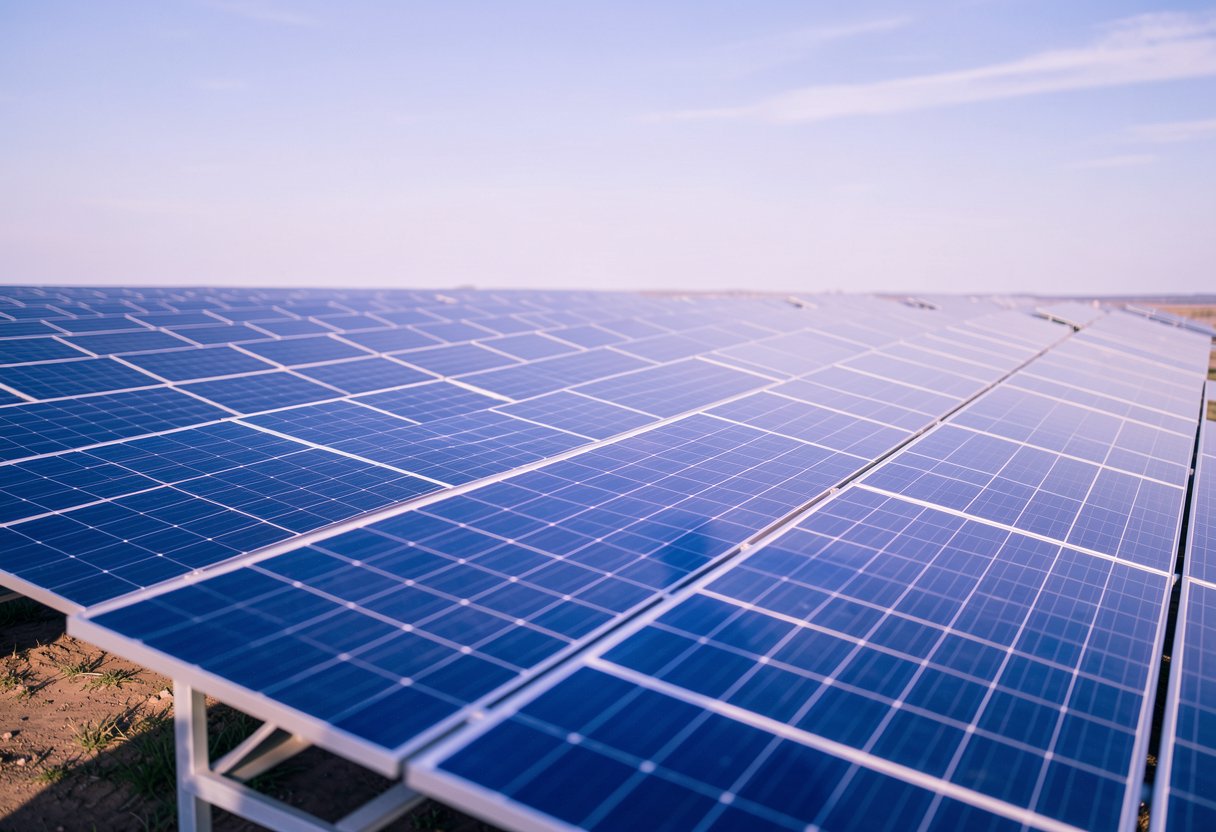
Stromfee
Sonnenkraft im Detail: Aktuelle Leistungsdaten unserer 664-kW-PV-Anlage
21. Juli 2025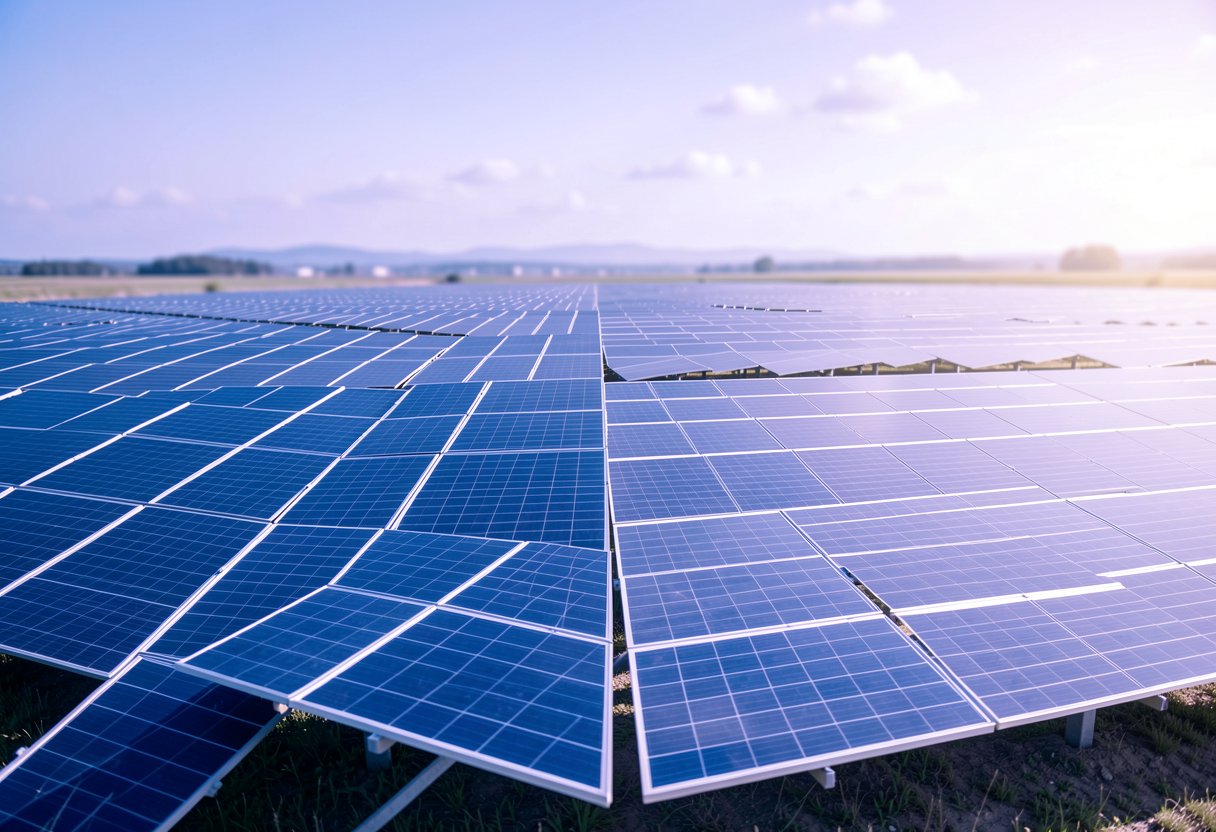
Stromfee
PV-Anlage im Fokus: Leistungsdaten und Effizienzanalyse
20. Juli 2025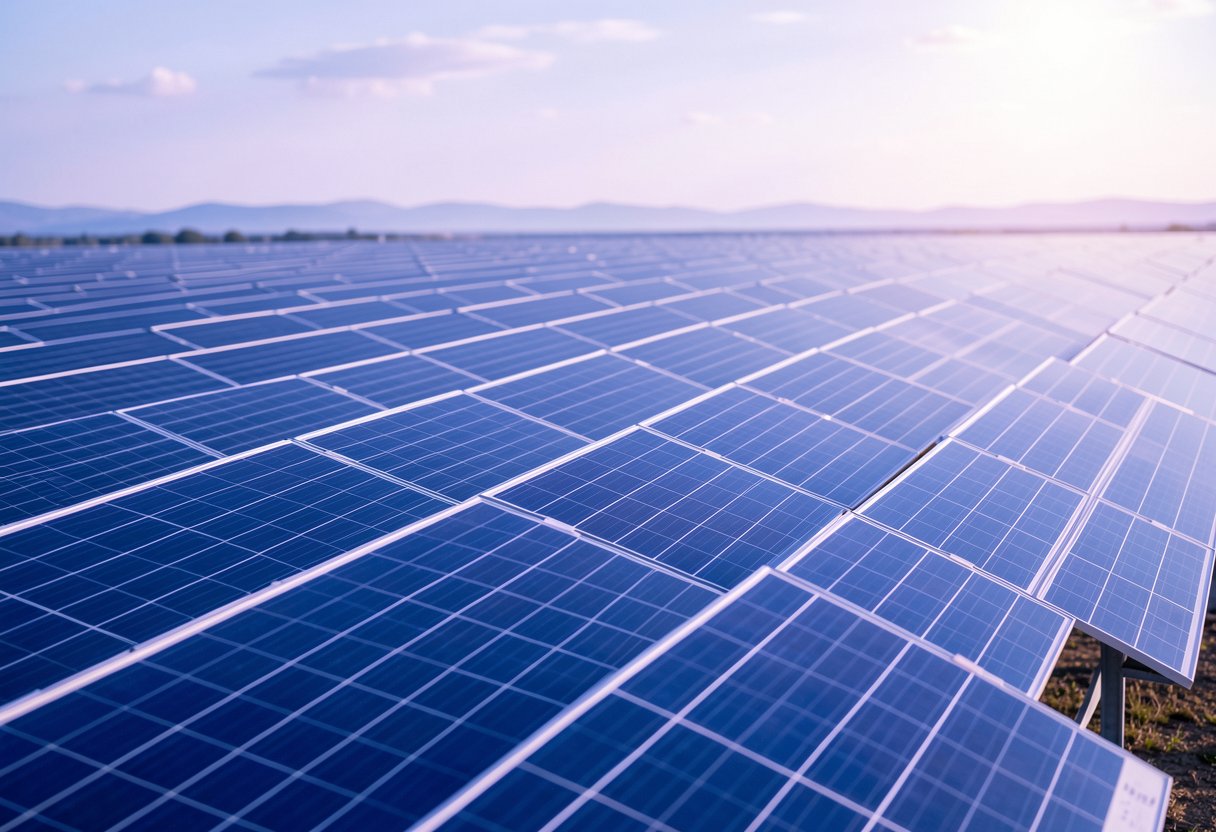
Stromfee
Energieanalyse: Unsere PV-Anlage unter der Lupe!
18. Juli 2025
Stromfee
Energieanalyse: Die Sonnenkraft Deiner PV-Anlage im Überblick
17. Juli 2025
Stromfee
Unsere PV-Anlage: Leistungsstarke Sonnenenergie im Überblick
16. Juli 2025Häufige Fragen
Was ist der Stromfee Blog?
Der Stromfee Blog ist eine Plattform mit Tools und bietet Beiträge von Stromfee Aigmail Com.
Wie viele Beiträge hat der Autor "Stromfee Aigmail Com" veröffentlicht?
Der Autor "Stromfee Aigmail Com" hat 20 Beiträge veröffentlicht.
Worum geht es in den Blogbeiträgen?
Die Blogbeiträge behandeln Themen wie Energiepreise, Strommarktveränderungen und Leistungsdaten von Photovoltaikanlagen.
Welche Art von Solaranlage wird im Blog detailliert beschrieben?
Im Blog werden eine 664-kW-Photovoltaikanlage sowie eine 1000-kWp-Solaranlage detailliert beschrieben, inklusive ihrer Leistung und Effizienz.