Energy Insights: A Journey Through Temperature, Power, and Sustainable Living

Energy Insights: A Journey Through Temperature, Power, and Sustainable Living
Views: 0
Hey everyone! 🌟 Let’s dive into some intriguing energy consumption trends with a fun, visual twist! 📊
🌡️ **Temperature Tales:** First off, we’ve been tracking temperatures across various zones, and here’s the scoop: Room temps (‘Raumtemperatur’) are snug at about 22°C – no wild swings here! But water temperatures (‘Wassertemperatur’) are on a rollercoaster between 6.5°C and 9.6°C. Ever noticed it getting warmer when the sun shines through your window? That’s probably solar gain at play, or perhaps your heating kicking in. Cool, right?
⚡ **Power Play:** Moving on to power consumption, our gadgets and gizmos pull an average of 589W. But there are moments when this spikes – think of it as the power rush hours! Keeping an eye on these could help us use energy when it’s cheaper and greener.
🏠 **Room by Room:** Now, if we zoom into specific rooms, some are cooler, and others hit peaks like 21.4°C. A hint that our heating might be working a bit harder than needed in some spots?
🌞 **Sun Power Performance:** Our solar power system dances with the daylight, peaking beautifully at 7.40 kW. Yet, it tapers off as the sun sets – typical solar behavior but something we might optimize for even better results!
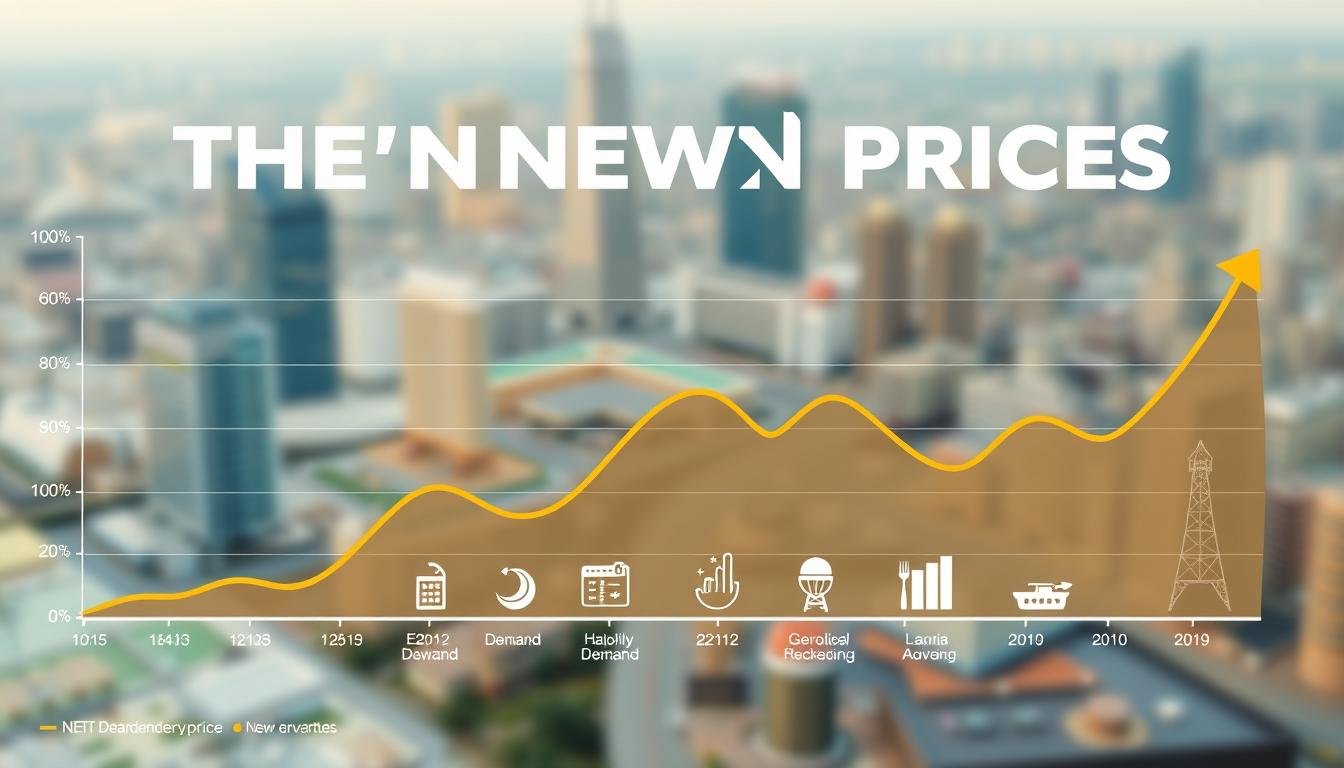
🔁 **Usage Patterns Unveiled:** Lastly, our dynamic chart shows a sawtooth wave pattern of energy use, reflecting how our systems toggle on and off throughout the day. And guess what? The average power used sits nicely at 71.5W during quieter times, suggesting we’re pretty nifty with energy when we’re not all hands on deck.
🌍 **Wrapping Up:** All this data blending together helps us spot how temperature changes affect our power use and vice versa. There’s room to tweak our energy habits for better efficiency and sustainability – and isn’t that something we all strive for?
Feel free to share your thoughts or tips on how you manage energy use at home or work! 💡🏡 #EnergyTrends #Sustainability #PowerSmarthttp://www.stromfee.graphics/images_sshot/leonardo_image_20250407_135313_1.png


