Temp Tango: How Weather Waves Drive Your Energy Usage

Temp Tango: How Weather Waves Drive Your Energy Usage
Views: 0
Hey there, weather watchers and energy enthusiasts! 🌡️⚡ Have you ever wondered how the chilly days of winter or those unexpected warmer spells impact our power usage? Let’s dive into some cool insights!
Swipe through our charts showing data from Jan 15 to Feb 11. You’ll notice that our temps danced between a frosty -5°C to a comfy +15°C. Did you catch that dip around Jan 21? Yep, that’s winter showing its chilly side, but then things started heating up towards the end of the period. Keep an eye on those surprise spikes around Jan 30 – totally screams unusual weather, right?
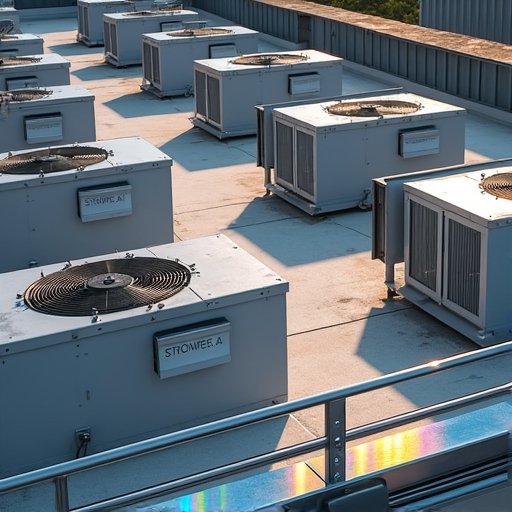
Next up, let’s talk about energy sipping (or gulping) by cooling compressors. Did you spot the peaks around Jan 25 and Feb 2 where consumption hit above 30 kW? This probably means everyone cranked up their coolers because of those warmer days. Overall, though, the average was chill at 12.2 kW.
Now, here’s where it gets spicy 🌶️: As those temps went up, so did our energy needs for cooling. Ever noticed your AC working overtime when it suddenly gets hot? That’s what’s happening!
But wait, there’s more! Sometimes our systems react a bit late to temperature changes, leading to energy peaks following those warm or cold snaps. Also, that sudden energy jump on Jan 25? It looks like we were trying to beat the cold from a few days earlier. Sneaky, huh?
Wrapping this up – understanding how temps and energy interact can help us be smarter about power use. It’s all about tuning in to Mother Nature’s vibe and adjusting our habits and tech to be more energy-efficient. 🍃💡 Let’s use these insights to not just react to but anticipate changes and save some energy (and maybe cash too!).
Check out our graphs and let’s chat more about this! Have you noticed any quirky weather-energy moments at your place? Share below! 😊
#WeatherWonders #EnergyEfficiency #SmartLiving #DataScience #GoGreenhttp://www.stromfee.ai/images_sshot/leonardo_image_20250213_034729_1.png


