
Stromfee
Energy Insights: Navigating Temperature, Consumption, and Sustainable Solutions
13. Apr. 2025
Stromfee
Unlocking Energy Efficiency: Temperature, Trends, and Smart Management Insights
13. Apr. 2025
Stromfee
Energy Dynamics: Navigating Power, Temperature, and Efficiency Insights
13. Apr. 2025
Stromfee
Decoding Energy Dynamics: Unveiling Smart Home Performance and Efficiency Insights
13. Apr. 2025
Stromfee
Energiepuls New York: Dynamische Einblicke in den Stadtrhythmus der Stromversorgung
13. Apr. 2025
Stromfee
Energy Dynamics Decoded: Your Smart Home Performance Insights
13. Apr. 2025
Stromfee
Energy Insights Unveiled: Decoding Power Patterns and Environmental Trends
13. Apr. 2025
Stromfee
Energy Efficiency Unveiled: Insights into Power, Temperature, and Smart Consumption
13. Apr. 2025
Stromfee
Energizing Insights: A Deep Dive into Home Energy Performance and Efficiency
13. Apr. 2025
Stromfee
Decoding Energy Dynamics: Temperature, Usage, and Efficiency Unveiled
13. Apr. 2025
Stromfee
Energy Insights: Unveiling the Hidden Patterns of Home Power Consumption
13. Apr. 2025
Stromfee
Weather and Energy Consumption in New York: Insights into Interconnected Dynamics
13. Apr. 2025
Stromfee
Cozy Comfort: Navigating Home Energy and Temperature Insights
13. Apr. 2025
Stromfee
Energy Insights: Navigating Temperature, Power, and Efficiency Trends
13. Apr. 2025
Stromfee
Energy Performance Insights: A Comprehensive Dashboard Analysis of Temperature, Consumption, and Efficiency
13. Apr. 2025
Stromfee
Powering Progress: A Deep Dive into Energy Efficiency Metrics
13. Apr. 2025
Stromfee
Energy Insights: Decoding Power Consumption and Temperature Dynamics
13. Apr. 2025
Stromfee
Energy Insights: Mastering Comfort and Efficiency in Real-Time
12. Apr. 2025
Stromfee
Energiedynamik New York: Ein Einblick in Klima, Solar und Verbrauchsmuster
12. Apr. 2025
Stromfee
Energy Insights: Power, Temperature, and Efficiency Unveiled
12. Apr. 2025
Stromfee
Die "neue Normalität" der Energiepreise – Und wie Sie sie zu Ihrem Vorteil nutzen
12. Nov. 2025
Stromfee
Strommarkt vor einem Paradigmenwechsel: Statt Stundenpreisen gibt es künftig 96 Preissignale am Tag
2. Nov. 2025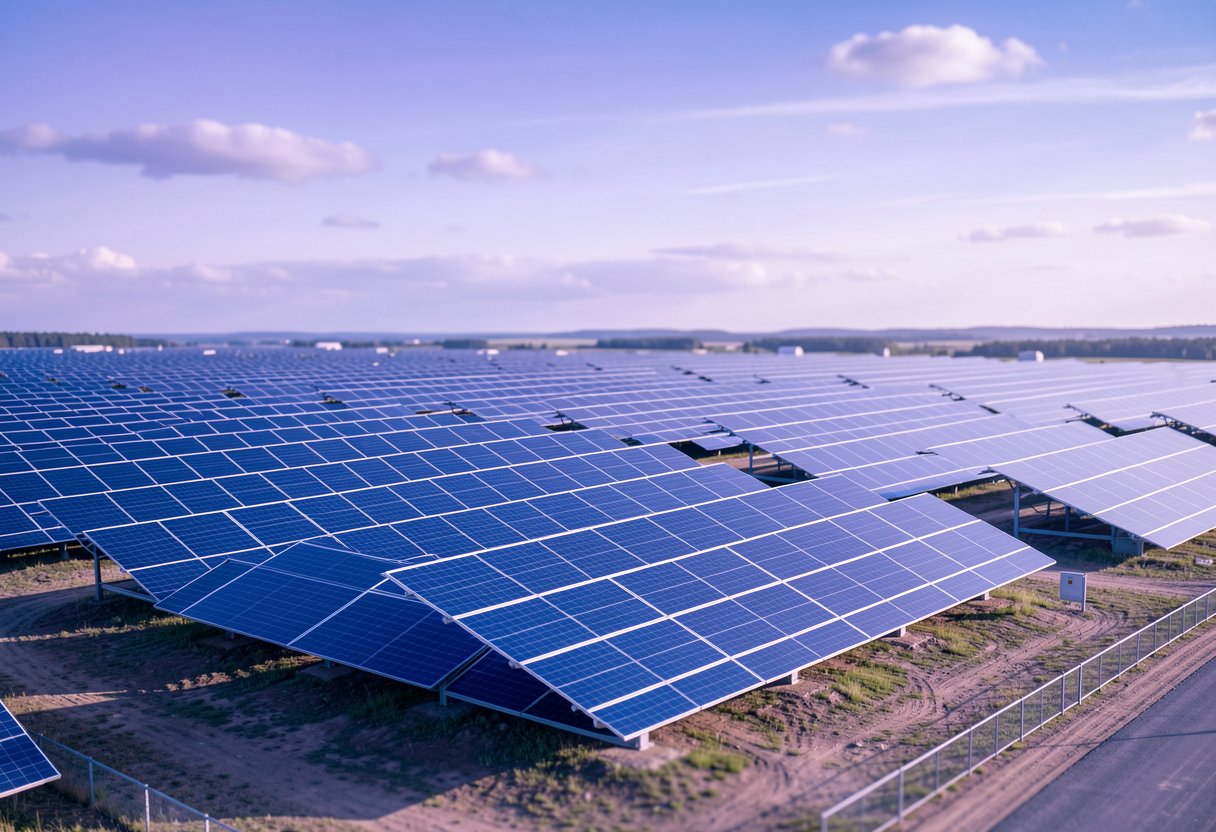
Stromfee
Solarpower im Detail: Die beeindruckenden Leistungsdaten unserer 664-kW-Photovoltaikanlage
5. Aug. 2025
Stromfee