
Stromfee
**Motor Performance Deep Dive: Decoding 48-Hour Operational Insights**
27. Mai 2025
Stromfee
Urban Heat Horizons: A Global City Temperature Snapshot
27. Mai 2025
Stromfee
Motor Performance Insights: A 48-Hour Data Analysis Breakdown
27. Mai 2025
Stromfee
Technical Performance Analysis: Motor Power and Efficiency Insights
26. Mai 2025
Stromfee
48-Hour Engine Performance Analysis: Electricity Prices, Power Output, and Efficiency Insights
26. Mai 2025
Stromfee
Motor Performance Insights: Navigating Energy Efficiency and Operational Stability
25. Mai 2025
Stromfee
Motor Performance Insights: 48-Hour Energy Efficiency Snapshot
25. Mai 2025
Stromfee
Motor Operations Insights: A 48-Hour Performance Overview
25. Mai 2025
Stromfee
Motor Performance Insights: Navigating Electricity Costs and Operational Efficiency
24. Mai 2025
Stromfee
Power Operations Insights: A 48-Hour Performance Snapshot
24. Mai 2025
Stromfee
Urban Heat Wave: A Climate Journey Across Asia's Metropolises
24. Mai 2025
Stromfee
Motor Performance Insights: Navigating Energy Trends, Voltage Stability, and Operational Efficiency
24. Mai 2025
Stromfee
Motor Performance Insights: 48-Hour Operational Analysis and Efficiency Review
23. Mai 2025
Stromfee
Motor Performance Insights: Navigating Efficiency and Cost in the Last 48 Hours
23. Mai 2025
Stromfee
"Sizzling Cities: A Global Heatwave Temperature Analysis"
23. Mai 2025
Stromfee
Motor Performance Insights: Navigating Energy Dynamics and Operational Stability
23. Mai 2025
Stromfee
Motor Performance Insights: A 48-Hour Operational Review
22. Mai 2025
Stromfee
Energy Insights: A Playful Peek into Motor Performance and Power Dynamics
22. Mai 2025
Stromfee
**Urban Heat Waves: Decoding Temperature Dynamics Across Asian Cities**
22. Mai 2025
Stromfee
Powering Performance: A Strategic Guide to Motor Health and Efficiency
22. Mai 2025
Stromfee
Die "neue Normalität" der Energiepreise – Und wie Sie sie zu Ihrem Vorteil nutzen
12. Nov. 2025
Stromfee
Strommarkt vor einem Paradigmenwechsel: Statt Stundenpreisen gibt es künftig 96 Preissignale am Tag
2. Nov. 2025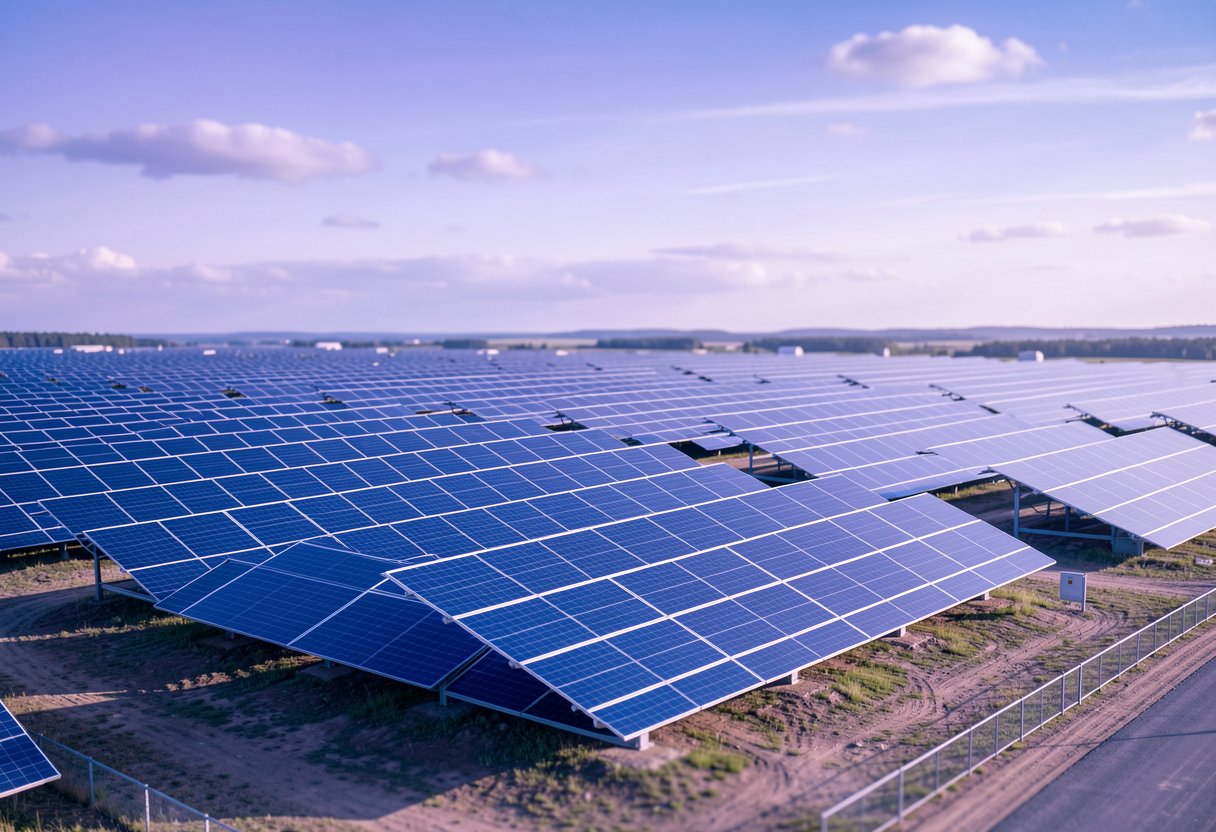
Stromfee
Solarpower im Detail: Die beeindruckenden Leistungsdaten unserer 664-kW-Photovoltaikanlage
5. Aug. 2025
Stromfee