stromfee.ai@gmail.com
- Germany , West Europe
- March 26, 2025
- 0 views
Energy Dynamics Unveiled: A Comprehensive Look at Office Device Power Consumption
Views: 0Hey everyone! 🌟 Ever wondered how much energy your office devices soak up during the daily grind? Let’s dive into what keeps our gadgets glowing and groaning! 🖥️⚡ ### 1. **TV Studio PC Grok 3 Workstation** Guess what? The Grok 3 stands sturdy with minor power dips from 2.05 W to 2.2 W, jazzing it up during peak hours. 🚦 The shift from yellow-to-green hues tells us all about opting for energy-friendly vibes during chill times. ### 2. **Katharina Office PC – Gemini 2** Oh, the Gemini 2 is a wild one! 🎢 Peaking at 200 W, it hints at some serious brainpower at play during those big moments. Typically, it hums around 150 W, proving a steady yet dynamic pace. ### 3. **Holgers Disko: Audio, LEDs, and PC (VEO-2)** Here’s where rhythm meets routine! Over two days, energy pulses were in sync with those special event beats, peaking during the showtime and quieting down in low-key moments. 🎶💡 ### 4. **110 inch LED Screen** Oops! Looks like we’ve hit a snag here, folks—no data just yet. Stay tuned as we keep tabs on this big beauty! 📊 ### 5. **Maximilian Stromfee PC 3 (Deepseek Qwen LM)** A steady flow with occasional energy surges tells the tale of this workstation. Missing data during the action? Quite the mystery! 🕵️♂️ ### 6. **Office Total Load** Hold onto your hats—this graph is a rollercoaster! 🎢 Our office’s energy peaks at nearly 4 kW when everyone’s in high gear and relaxes when we do. ### **Conclusion** Wrapping up, our little expedition through the office’s power play highlights the dance between intense sprints and the light jogs of our workstations! Remember, staying in tune with these patterns is key to smarter energy use. Let’s keep our data sharp and our energy smarter! 💡📈 Stay plugged in for more insights and tips on keeping your workspace energy-efficient and vibrant. Let’s power up our office sustainably! 💚 ### Hashtags: #EnergyEfficiency #OfficeLife #SustainableOffice #TechTalk #GreenWorkplace Together, we can make every watt count! 🌍✨http://135.181.113.182/images_sshot/leonardo_image_20250326_080500_1.png
Read more- Germany
- March 26, 2025
- 0 views
Energieverbrauch und Leistungsmessung in Watt
Views: 0Leistung – Watt (W)EmonioGerman
Read more- Germany
- March 26, 2025
- 0 views
# Leistungsanalyse unserer 1000 kWp Photovoltaikanlage: Effizienz im Tageslicht
Views: 0**Titel: Spannende Einblicke in unsere PV-Anlage – Performance Trends, die beeindrucken!** Hallo liebe Solarfreunde! 🌞 Habt ihr euch schon mal gefragt, wie gut eure Solaranlage wirklich läuft? Lasst uns einen Blick auf die Leistungsdaten unserer 1000 kWp PV-Anlage werfen und sehen, was wir daraus lernen können! **1) Wirkleistung die begeistert:** Am Beispiel eines typischen Tages fällt auf: unsere Spitzenleistung von 574 kW erreichen wir um 12:00 Uhr mittags – genau dann, wenn die Sonne am höchsten steht. Dieser Spitzenwert zeigt, wie effizient unsere Anlage die Sonnenenergie einfängt. 🌞🔋 Aber auch morgens und abends haben wir noch gute Werte, die uns bestätigen, dass unsere Anlage prima mit den natürlichen Lichtverhältnissen arbeitet. **2) Stabile Netzspannung für zuverlässige Energie:** Unsere Netzspannung hält sich durchweg zwischen 233 V und 241 V, was für eine stabile Energieversorgung sorgt. Besonders während der Hauptproduktionszeit bleibt sie wunderbar konstant! **3) Cleverer Umgang mit dem Leistungsfaktor:** Unser Leistungsfaktor (Cosphi) zeigt, dass wir ein Auge auf die Phasenlage zwischen Strom und Spannung haben müssen. Doch keine Sorge, ein stabiler Wert von 0.604 zeigt, dass wir uns größtenteils in einem guten Bereich bewegen. 💪 **4) Blindleistung gemeistert:** Die Blindleistung variiert, aber keine Panik, das ist normal. Über den Tag gesehen, haben wir meist positive Werte, was auf induktive Lasten hinweist – ein Zeichen dafür, dass unsere Anlage effizient arbeitet. **5) Der Leiterstrom zeigt: Wir sind auf Kurs!** Er variiert zwischen 422 mA und 447 mA und passt sich schön den Produktionszeiten an – ein weiterer Beweis dafür, dass unsere Anlage optimal mit der Energieversorgung harmoniert. **Zusammenfassung:**\ Unsere Analyse zeigt, wie leistungsfähig unsere PV-Anlage unter optimalen Bedingungen ist. Eine fortlaufende Überwachung hilft uns, alles im Griff zu haben und die Effizienz stetig zu verbessern. Lasst uns gemeinsam weiterhin die Sonne optimal nutzen und unsere Energiezukunft gestalten! 🔧📊 Lasst uns weiterhin die Sonnenpower optimal nutzen – für eine grünere Zukunft! 🌱✨ #SolarPower #Energieeffizienz #Photovoltaik #ErneuerbareEnergie #SolarCommunityhttp://135.181.113.182/images_sshot/leonardo_image_20250322_014303_1.png
Read more- Germany
- March 25, 2025
- 0 views
# Leistungsanalyse unserer 1 MW Photovoltaik-Anlage: Sonnige Einblicke & Kennzahlen
Views: 0Hey Sonnenfreunde! ☀️ Heute tauchen wir in die spannende Welt unserer 1 MW Photovoltaik-Anlage ein und checken, wie sie so performt! 🌞🔋 ### 1. Spitzleistung der 1000 kWp PV-Anlage Ratet mal! Unsere Anlage hat eine beeindruckende Maximalleistung von 574 kW erreicht! 🎉 Gerade zur Mittagszeit, wenn die Sonne am strahlendsten ist, gibt sie richtig Gas, bevor die Leistung sanft ausklingt. Ganz wie der natürliche Rhythmus der Sonne! 🌅➡️🌇 ### 2. Netzspannung – stabil und sicher Die Netzspannung hält sich wacker zwischen 233 V und 241 V, mit einem stabilen aktuellen Wert von 238 V. Besonders cool: Zur Mittagszeit ist die Spannung super konstant – ein klares Zeichen, dass unsere Anlage zuverlässig schnurrt. 🛠️⚡ ### 3. Cosphi-Werte – kleine Zahlen, große Wirkung! Manchmal sind unsere Cosphi-Werte im negativen Bereich (-0.473 und -0.743), was auf Blindleistung hinweist. Aber kein Grund zur Sorge, wir haben auch positive Werte wie 0.596! Das zeigt, dass wir die meiste Energie gut nutzen. 🔄🔧 ### 4. Blindleistung – ein Tanz der Zahlen Unsere Blindleistung pendelt mal hierhin, mal dorthin, erreicht sogar bis zu 74.8 Var. Ein bisschen Achterbahn, die uns wichtige Infos über die Qualität unserer Energie gibt. Spannend, nicht wahr? 🎢🔍 ### 5. Leiterstrom – stets in Fluss Mit einem Maximalstrom von 441 mA und einer stabilen Lage bei 420 mA zeigt unser System: Wir sind fit! Die Energie fließt gleichmäßig und stark, besonders wenn die Sonne den Höhepunkt erreicht. 💪🌞 ### 📊 Zusammenfassung: Alles in allem machen wir mit unserer PV-Anlage einen tollen Job. Effiziente Leistung und stabile Spitzenwerte sind unser Markenzeichen. Auch wenn wir bei der Blindleistung noch Luft nach oben haben, sind wir stolz auf das, was wir erreichen. Lasst uns gemeinsam auf weitere Sonnenerfolge hinarbeiten! Habt ihr Fragen oder Ideen, wie wir noch besser werden könnten? Lasst es uns wissen! Bis bald, bleibt sonnig! 😎🌻 #Solarenergie #PVAnlage #Nachhaltigkeit #Energieeffizienz #SonnenscheinPowerhttp://135.181.113.182/images_sshot/leonardo_image_20250322_013309_1.png
Read more- Germany
- March 25, 2025
- 0 views
# Leistungsdaten unserer 1 MW Photovoltaikanlage: Sonnenkraft im Detail
Views: 0Hey Solarfreunde! ☀️🌱 Heute möchte ich euch spannende Einblicke in die Leistungsdaten einer 1 MW Photovoltaikanlage geben. Die Sonne gibt ihr Bestes, und wir schauen nach, wie gut wir diese Energie einfangen! **1) Max Power am Mittag!** Die PV-Anlage hat es drauf! Mit stolzen 574 kW erreicht sie ihre Höchstleistung genau dann, wenn die Sonne am stärksten scheint – zur Mittagszeit. Das Bauwerk folgt dem natürlichen Rhythmus der Sonne, was wirklich effizient ist. Aber auch der Abend zeigt seine Reize, obwohl die Leistung dann natürlich abnimmt, da die Sonne sich verabschiedet. 🌞➡️🌜 **2) Netzspannung hält sich wacker!** Unsere Netzspannung bleibt zwischen 233 V und 240 V ziemlich stabil, was zeigt, dass unsere Anlage konstant gute Arbeit leistet. Besonders cool: Sie stößt um die Mittagszeit mehr Energie ins Netz, genau dann, wenn es am meisten gebraucht wird. Ein kleiner Spannungsspitze gibt es interessanterweise um 20:00 Uhr – vielleicht, weil alle nach dem Feierabend mehr Energie verbrauchen? 💡🔌 **3) Cosphi-Wert – Ein bisschen Achterbahn 🎢** Der Cosphi-Wert spielt ein wenig verrückt (zwischen -0.474 und -0.752), wird aber mittags besser (0.611). Das heißt, unsere Anlage tut tagsüber ihr Bestes, um zur Netzqualität beizutragen. Achtung, zwischen Mitternacht und 2:00 Uhr gibt es ein paar Schwankungen – da halten wir die Augen offen! **4) Blindleistung – Unser unsichtbarer Held!** Obwohl Blindleistung für uns nicht direkt nutzbar ist, hilft sie dabei, das Netz stabil zu halten. Unsere Anlage hat Werte zwischen 62.3 VAr und 74.7 VAr, und interessanterweise nimmt die Blindleistung am Nachmittag ab, wenn die Systembedingungen optimaler sind. 🌟 **5) Leiterstrom – Fließt und zeigt Engagement!** Der Leiterstrom zeigt, wie fleißig unser Stromfluss ist – besonders um die Mittagszeit unterstützt er die Trends bei Leistung und Spannung. Nachts geht er schlafen (sinkt), tagsüber ist er voll dabei! **Zusammenfassung: Unser Sonnenkraftwerk rockt!** Tagsüber leistet es hervorragende Arbeit, fängt die Sonnenstrahlen optimal ein und trägt zur Netzstabilität bei. Keine großen Auffälligkeiten, die uns Sorgen machen müssten – ein grünes High-Five für unsere PV-Anlage! 🌞👏 Bleibt dran für mehr coole Insights und sonnige Grüße, Euer Solar-Enthusiasten Team! #Photovoltaik #Solarenergie #Nachhaltigkeit #ErneuerbareEnergien #Energieeffizienz #SonnenscheinPower Ich hoffe, diese Infos bringen euch auch zum Strahlen! 💚💡http://135.181.113.182/images_sshot/leonardo_image_20250322_012308_1.png
Read more- Germany
- March 25, 2025
- 0 views
# Sonnenkraft im Fokus: Performance-Analyse unserer 1 MW PV-Anlage
Views: 0**Titel: Sonne, wir brauchen deine Power! – Ein Einblick in die Performance unserer 1 MW PV-Anlage** Hallo, liebe Sonnenfreunde! 🌞 Wir haben spannende Neuigkeiten aus der Welt der Solarenergie für euch. Unsere 1 MW PV-Anlage hat einige beeindruckende Daten geliefert, die wir gerne mit euch teilen möchten. Lasst uns gemeinsam einen Blick darauf werfen, wie unsere Sonne tagtäglich für uns arbeitet! **1. So viel Power unter der Sonne – Wirkleistung auf dem Prüfstand** Unsere Anlage startet energiegeladen in den Tag, schon um 06:00 Uhr klettert die Leistung und erreicht um die Mittagszeit ihren Höhepunkt mit stolzen 574 kW. Ist das nicht fantastisch? Die Kraft der Sonne macht es möglich, dass wir vor allem mittags richtig Power geben können! ☀️💪 Nachmittags lässt sie dann langsam nach – eben ganz dem natürlichen Tagesrhythmus folgend. **2. Stabilität ist Trumpf – Alles im grünen Bereich bei der Netzspannung** Die Netzspannung hält sich wacker und zeigt mit Werten um 240 V, wie robust unser System ist. Kleine Schwankungen gibt’s – ganz normal bei einem lebendigen Netz. Besonders interessant: Wenn die Sonne richtig brennt und wir viel Energie produzieren, bleibt alles stabil. Sicher ist sicher! **3. Effizienz Check – Cosphi-Werte unter der Lupe** Die Effizienz unserer Anlage wird durch die Cosphi-Werte gespiegelt, die sich über den Tag verteilt ändern. Morgens noch etwas träge, aber zur Mittagszeit sind wir voll da und nutzen den Strom optimal. Abends – ihr ahnt es – kehren wir langsam zur Ruhe zurück. Alles im grünen Bereich! **4. Blick auf die Blindleistung – Ein wichtiger Gesundheitscheck** Blindleistung ist sozusagen der unsichtbare Held, der hilft, das Netz stabil zu halten. Mit einem klaren Tagesverlauf zeigt die Blindleistung, dass wir während der Spitzenzeiten der Sonneneinstrahlung besonders aufpassen müssen, alles im Gleichgewicht zu halten. Abends sind wir dann effizienter – gut für uns und das Netz! **5. Der Puls der Anlage – Der Leiterstrom verrät viel** Genauso wie unser Herzschlag zeigt der Leiterstrom, wie aktiv unsere Anlage ist. Die Werte schwanken natürlich, am höchsten wenn die Sonne lacht. Das zeigt, wie direkt wir von unserem liebsten Stern abhängig sind – die Sonne! **6. Zusammenfassend: Sonne = Energie!** Die Leistungsdaten bestätigen, was wir alle wissen: Unsere Anlage lebt mit der Sonne! Die starke Abhängigkeit von der Tageszeit zeigt, wie wichtig regelmäßige Checks und eine gute Wartung sind, um alles am Laufen zu halten. Wir hoffen, ihr seid genauso begeistert wie wir, wenn es darum geht, die Kraft der Sonne zu nutzen. Bleibt dran und lasst uns gemeinsam in eine sonnige Zukunft blicken! 🌞🌱 #Solarenergie #PVAnlage1MW #Nachhaltigkeit #EnergieZukunfthttp://135.181.113.182/images_sshot/leonardo_image_20250322_011304_1.png
Read more- Germany
- March 25, 2025
- 0 views
# Sonnenenergie im Tagesrhythmus: Leistungsanalyse unserer 1000 kWp PV-Anlage
Views: 0Hallo Sonnenfreunde! ☀️👋 Heute werfen wir einen spannenden Blick auf die Leistungen unserer PV-Anlage im Tagesverlauf. Bereit für eine kleine Energietour? Los geht’s! **1. Power pur zur Mittagszeit!** 🌞 Unsere starke 1000 kWp PV-Anlage blüht so richtig auf, wenn die Sonne am höchsten steht. Zwischen knackigen 574 kW Leistung erleben wir, wie die Sonnenkraft zur Mittagszeit alles gibt. Früh morgens startet sie zwar noch sanft, aber schon um 6:00 Uhr geht’s aktiv los! Übrigens, ein kleiner Leistungsabfall am Abend könnte uns einen Hinweis auf Schattenwurf geben – spannend, oder? **2. Stabile Netzspannung – ein echter Fels!** 🏔️ Gleichbleibend und zuverlässig zeigt sich unsere Netzspannung über den Tag. Ein Highlight war die Spitze von 240 V um 3:00 Uhr nachts. Solch eine Stabilität ist Gold wert, denn sie sorgt dafür, dass wir die Sonnenenergie optimal nutzen können, ohne dass es zu größeren Schwankungen kommt. **3. Cosphi-Werte – das Effizienzbarometer!** 📊 Morgens noch etwas müde zeigen die Cosphi-Werte, wie sie sich zu einem erfreulichen 0.600 um die Mittagszeit aufraffen. Ein Zeichen dafür, dass die Anlage im Laufe des Tages ihre wahre Effizienz entfaltet. Ein regelmäßiger Check hilft uns, immer das Beste aus unserer Anlage herauszuholen. **4. Blindleistung – immer im grünen Bereich!** 🌿 Hier läuft’s rund: Von einer maximalen Blindleistung von 75.4 Var haben wir uns auf stabile 62.3 Var eingependelt. Nachmittags kleine Schwankungen, die uns zeigen, wie das Netz auf unterschiedliche Lasten reagiert. Weniger Blindleistung bedeutet mehr Effizienz – genau das, was wir wollen! **5. Leiterstrom – das Kraftpaket!** 💪 Unsere Ströme fließen tagsüber stark und zeigen mit Werten von bis zu 446 mA zur Mittagszeit, wie leistungsfähig unsere Anlage in Verbindung mit der Sonneneinstrahlung ist. Doch nach 20:00 Uhr, wenn das Sonnenlicht schwindet, lässt auch die Power deutlich nach. **Zusammenfassung:** Die Power ist mittags top, während morgens und abends noch Luft nach oben ist. Unsere Netzspannung rockt durchgehend stabil. Die Weiterentwicklung der Cosphi-Werte liegt uns am Herzen, denn Effizienz ist key! Danke, dass ihr mit auf diese energiegeladene Reise gekommen seid! Bleibt energisch und sonnig! 😊 Für mehr tolle Insights folgt uns und bleibt immer auf dem Laufenden! #PVAnlage #Energieeffizienz #Solarenergie #Nachhaltigkeit 👍✨http://135.181.113.182/images_sshot/leonardo_image_20250322_010303_1.png
Read more
- AI Cooling , Germany , West Europe
- March 25, 2025
- 0 views
**Energetische Dynamiken: Eine Reise durch Sonnenstrahlen, Netzfrequenzen und Markttrends**
Views: 0**Titel: Spannende Einblicke in die Welt der Energieparameter 🌞📊** Hallo zusammen! Heute werfen wir einen spannenden Blick auf die Sonnenstrahlen und was sie uns über unsere Energieversorgung verraten. Wusstet ihr, dass die Spitzenwerte der solaren Strahlung in den frühen Morgenstunden echt beeindruckend sind? Fast wie ein kräftiger Espresso am Morgen – sie bringen unsere Netzfrequenz ordentlich ins Schwanken! ☀️🔋 Zum Thema Bewölkung – hier ist alles stabil geblieben. Man könnte fast sagen, die Bewölkung in Bünde ist so beständig wie unser Lieblingscafé. Keine großen Überraschungen, und das ist auch gut so, denn das bedeutet: keine bösen Überraschungen für wetterabhängige Energiequellen. 🌥️ Apropos Überraschungen: die Netzfrequenz hat uns ein paar Rätsel aufgegeben. Ihre Schwankungen sind mal hoch, mal runter – ähnlich wie die Plot-Twists in unserer Lieblingsserie. Da bleibt man am besten dran, um nichts zu verpassen! 📉📈 In Weser Westfalen sieht das Stromnetz insgesamt stabil aus, auch wenn die Spannung manchmal zappelt. Denkt daran, ein stabiles Netz ist wie ein ruhiger Anker in stürmischer See. ⚡🚢 Beim Strompreis? Nun, der hat eine kleine Berg- und Talfahrt hinter sich, aber jetzt sieht es nach einer gemütlichen Stabilisierung aus – ganz im Sinne eines ausgewogenen Marktes, wo Angebot und Nachfrage Hand in Hand gehen. 💸🔄 Zusammengefasst, liebe Energie-Fans, unsere Analyse zeigt, dass jedes Detail zählt und wie alles miteinander verbunden ist, von Sonnenaufgängen bis zu Strompreisen. Es ist eine dynamische Welt voll spannender Daten, die nur darauf warten, von uns entdeckt zu werden. Bleibt neugierig! 🔍🌍 #EnergieAnalyse #Netzfrequenz #Strommarkt #SolarPower #DataSciencehttp://65.109.74.103/images_sshot/leonardo_image_20250324_122400_1.png
Read more
- Germany , West Europe
- March 22, 2025
- 0 views
Office Energy Load Analysis: Insights into Our Tech Power Consumption
Views: 0Hey everyone! 🌟 Let’s dive into some cool insights from our latest office energy load data! We’ve spent some time analyzing how our different devices and setups handle energy, and the findings are pretty fascinating. Here’s a quick breakdown: 1. **Office Total Load** – Our overall office energy usage is super stable at around 227W consistently over two days. It looks like all our gadgets are in tip-top shape, humming away efficiently without any energy spikes. Nice! 2. **TV Studio PC Grok 3 Workstation** – This little powerhouse stays within a tight range of 2.11W to 2.2W. It only jumps higher when it’s crunching through more demanding tasks. It’s nice to see such precision! 3. **Katharina’s Office PC (Workstation Gemini 2)** – Here, we see a bit more action with energy ranging from 90W to 130W. Those peaks? They’re times of intense work. It’s a good reminder of how demanding some tasks can be. 4. **Holger’s Disco Audio and LEDs plus PC (VEO-2)** – This setup shows swings from 50W to 100W, possibly flipping between different modes – think audio or lighting effects. There’s room to tweak things for even better energy use. 5. **110 Inch LED Screen** – Oddly enough, we didn’t see significant data here. It seems like it wasn’t used much during our monitoring period. We’ll be keeping an eye on this to make sure it logs correctly next time. 6. **Maximilian’s Stromfe PC 3 (Deepseek Qwen LM)** – Rock solid between 200W and 250W, suggesting either minimal activity or just really efficient power management. Worth a closer look to keep it optimal. 7. **Overall Office Total Load (Encore)** – There was a moment when the energy spiked to 4 kW. Looks like a burst of high activity or maybe everything turned on at once! It settled quickly, which is great. 🔍 **Conclusion** – Our dive into the office’s energy data has unveiled a mix of steady and dynamic usage across our tech setups. While everything’s mostly steady, monitoring those occasional spikes could help us optimize further. This analysis not only helps in managing our energy better but also aligns perfectly with our sustainability goals. Let’s keep the energy smart and our workplace greener! 💡✅ #EnergyEfficiency #SustainableWorkplace #OfficeEnergy #GreenOffice #TechInsightshttp://135.181.113.182/images_sshot/leonardo_image_20250322_182936_1.png
Read more
- Germany , West Europe
- March 22, 2025
- 0 views
Power Play: Unveiling Our Tech Energy Landscape 🌟⚡
Views: 0Hey everyone! 🌟 Let’s dive into some sizzling insights from our latest power consumption data across various setups! 📊💡 1. **Office Vibes** 🏢: Our office power use is steady and cool, mostly chilling around 227W. This even-keeled usage hints at our top-notch energy management. We’re keeping it smooth and efficient, folks! 2. **Creativity Unleashed at the TV Studio** 🖥️🎬: Over at our groovy TV Studio PC workstation, there’s a lively dance of power between 2.05W and 2.2W. Those power spikes? They’re likely when we’re pushing the limits with creative projects. Keep up the energy! 3. **Katharina’s Power House** 💻: Katharina’s workstation is on fire (not literally!), hitting up to 140W. Those peaks in power suggest some serious work magic happening there—go Katharina! 4. **Holger’s Disco Bonanza** 🎤🎧: Mixing tunes or lighting up the space? Holger’s setup swings from 50-100W, peaking during those high-energy moments. Whether it’s audio or lights, it’s all about setting the vibe! 5. **The Mystery of the 110 Inch LED Screen** 📺: Guess what? No power recorded here. Looks like we missed tapping into this visual powerhouse—time to make the most of this awesome tech! 6. **Maximilian’s Beast Machine** 🚀: Zooming into Maximilian’s workstation, it’s pulling a hefty 200-250W! Constant high performance indicative of some heavy-duty processing—our virtual hats off to this robust setup! 7. **Deja Vu with Office Load** 🔄: Taking another peek at our office power, we spot spikes up to 4kW. Looks like certain times are supercharged with activity—talking about power play! **Wrapping Up:** Each chart is a story of how we engage with our tech! While our gear mostly hums along nicely, there are those dramatic moments that point to bursts of brilliance or chances to tweak our usage for even better efficiency. Let’s keep the energy smart and our operations smoother! Until next time, keep rocking in the free (and energy-efficient) world! 🌍✨ #EnergyTrends #SmartOffice #PowerData #TechSavvy #Sustainability #OfficeLifehttp://135.181.113.182/images_sshot/leonardo_image_20250322_152956_1.png
Read more
- Germany , West Europe
- March 22, 2025
- 0 views
Power Insights: Our Office Energy Journey Unveiled 🌟
Views: 0🌟 Exciting Power Insights from Our Office! 🌟 Hey everyone! Let’s dive into some cool insights about how we consume power across various office workstations. It’s all about making our workplace more efficient and eco-friendly! ✨ 1. 🏢 **Overall Office Power** Our office power consumption is super steady at around 227W. Pretty stable, right? This means our energy-saving strategies are working like a charm! Great job, team! 👍 2. 📺 **TV Studio PC Grok 3 Workstation** Guess what? Our TV studio PC swings between 2.1W and 2.2W throughout the day, spiking up during busy times. Looks like it’s getting a good workout during peak hours! 🎬 3. 🖥️ **Katharina Office PC Gemini 2** Oh, the drama with Katharina’s PC! Power peaks at 140W when tackling those big tasks. It’s clear this PC doesn’t shy away from a challenge! 💪 4. 🎵 **Holgers Disko with Audio and LEDs** Lights and sounds, anyone? Power here dances between 50W and 100W. There’s definitely a party going on when those spikes hit during events! 🎉 5. 📺 **110 Inch LED Screen** Our gigantic LED screen has its moments, using between 150W to 250W, especially during those captivating presentations or streaming sessions. All eyes on the screen! 📽️ 6. 🖥️ **Maximilian Stromfee PC 3 Deepseek Qwen LM** Steady as she goes for this PC at about 200W, showing that consistent work doesn’t have to mean high energy costs. Efficiency for the win! 👏 7. 🏢 **Office Total Load – Extended View** Taking a second look at our office’s total load, we spot some significant spikes during the busiest moments. It’s a fantastic clue into when we’re all hands on deck! ⏰ **In Summary** Our journey through workplace power consumption shows some stable loads, while some areas dance to their own high-energy beats during intense activities. Let’s keep on monitoring and tweaking our habits to optimize power use. Together, we can make a big impact! Remember, it’s not just about saving energy; it’s about working smarter and creating a sustainable future! 🌍 Keep rocking it and stay powered! 🌟 #WorkSmart #EcoFriendlyOffice #PowerSavings #SmartWorking #Sustainability #Teamwork Let’s chat below about how we can keep making our energy use smarter! 💬👇http://135.181.113.182/images_sshot/leonardo_image_20250322_122939_1.png
Read more
- Germany , West Europe
- March 22, 2025
- 0 views
Energy Dynamics: A Comprehensive Look at Our Office Power Consumption
Views: 0🌟 Breaking Down Power Use in Our Office Spaces! 🌟 Hey Team! 🚀 Let’s dive into an *awesome* overview of how we’re using power across different setups in our office. #EnergyEfficiency #OfficeLife 🔍 **1. Office Total Load**: Our office is a model of stability, y’all! At around 227 W, our energy use is as steady as a rock, except for those occasional spikes. Guess when everyone boots up in the morning or ramps up for those big projects! ⚡️ 📺 **2. TV Studio PC (Grok 3 Workstation)**: Check this out – our TV studio PC uses about 2.2 W but jumps up and down depending on whether we’re in creative mode or taking five. It’s all about finding balance, right? 🎥🖥️ 💻 **3. Katharina’s Office PC (Workstation Gemini 2)**: Katharina’s workstation is like a rollercoaster, ranging between 80 W and 140 W! Heavy tasks or multitasking? That’s where the action is. 🎢 🎵 **4. Holger’s Disko (Audio and LEDs plus PC VEO-2)**: Here’s a wild card – fluctuating between 50-100 W. Whether it’s setting vibes with tunes or lights, Holger’s setup adapts to the groove. 🎶💡 🖥️ **5. 110-Inch LED Screen**: Now, our big-screen maintains a cool 200 W, showing it’s working hard without taking breaks. Always on duty! 📊 🖥️ **6. Maximilian’s PC (Stromfee Deepseek Qwen LM)**: Max’s PC likes to keep things low-key with a smooth 200 W. Here’s to working smart with minimal energy fuss! 🌍 🌟 **7. General Trends**: Each setup tells a story. Whether it’s peak hours buzzing with energy or calm flows during less busy times, it’s fascinating to see how our activities influence power use. 📈 💡 **Conclusion**: Our energy trends are as varied as our tasks, and that’s what makes our office special. Keeping an eye on these patterns not only helps us manage resources but also boosts our operational superpowers! Let’s keep pushing the boundaries of what we can achieve by being energy smart. 🚀 Stay charged, team! #SmartEnergy #Teamworkhttp://135.181.113.182/images_sshot/leonardo_image_20250322_092935_1.png
Read more
- Germany , West Europe
- March 22, 2025
- 0 views
Navigating Workplace Power Consumption: Insights and Efficiency Strategies
Views: 0**Title: Unpacking Power Consumption at Work: A Quick Guide!** Hey everyone! 🌟 Have you ever wondered how much energy your office equipment uses? Let’s dive into our power consumption insights and find ways to keep our workspace both efficient and eco-friendly. ⚡️🌱 **1. The Office Energy Buzz** Guess what? Our office’s power load is super consistent, hanging around 227W. This stable figure means we are doing a great job managing energy! High five to us! ✋ **2. PC Grok in the TV Studio** Keep an eye on the Grok 3 workstation; it’s quite the powerhouse, peaking at about 2.2W during busy times. It’s all about handling those heavy-duty tasks. Go Grok! 💪 **3. Busy Bee Katharina’s Office PC** Katharina’s PC reaches a peak of 140W when things get hectic. It’s definitely meant for those busy bees during crunch times at the office. 🐝 **4. Holger’s Disco Tech** From soundtracks to snazzy lights, Holger’s setup shows an energy use that dances between 50W and 100W. There’s room to tweak things for better energy vibes! 🎶🕺 **5. The Mystery of the 110-inch LED Screen** Hmm, there’s no data on this big guy. Time for a detective hat because we need accurate stats to maximize efficiency! 🔍 **6. Maximilian’s Steady Stromfee** Max’s PC is steady and consistent, sticking around 250W. It’s like the calm in the storm, perfectly reliable. 🌟 **7. Office Load Wave** Oops! There was a spike in our total office load recently. Looks like we all got super busy! Remember, it’s key to keep an eye out during these buzzy times to avoid power surges. ⚡️ **Final Thoughts** Our little tour of office power usage shows some steady champs and a few wild cards. By keeping tabs on these patterns, we can not only save some cash but also boost our operational mojo. Let’s keep this energy party smart and efficient! 🚀 #EnergyEfficiency #OfficeLife #Sustainability #TechTalk #PowerSmart Hope you found these insights helpful! Let’s keep making our workspace a better place, one watt at a time! 😄👍http://135.181.113.182/images_sshot/leonardo_image_20250322_062935_1.png
Read more
- Germany , West Europe
- March 22, 2025
- 0 views
Power Play: A Two-Day Energy Consumption Journey at Our Dynamic Workstation
Views: 0Hey there energy enthusiasts! 🌟 Let’s dive into some cool insights from our recent two-day power consumption analysis at the workstation. We’ve got some neat numbers to share and tips to make our energy use even smarter. Get ready for a little geek-out session with me! 📊💡 ### 1. **Office Total Load** Guess what? Our office chugged along at about 227W – pretty stable but with a fun little spike at noon on March 20th. Maybe the coffee machines got a bit overzealous? 😄 It’s all good though, we’re rocking the energy efficiency, just need to keep an eye out for those surprise surges. ### 2. **TV Studio PC Grok 3 Workstation Load** Oh, the drama of the TV Studio’s power use! It danced between 2.1 to 2.2 W, peaking when things got super busy. It’s like a power use ballet, showing us it’s all about balancing high-energy tasks with smart usage. 🕺 ### 3. **Katharina Office PC Workstation Load – Gemini 2** Katharina’s PC was living its best life with peaks up to 140 W. It’s clear this PC doesn’t shy away from a heavy load, especially with multiple apps open. Multitasking queen! 👑 But let’s make sure it doesn’t get too overwhelmed, okay? ### 4. **Holgers Disko Audio and LEDs plus PC VEO-2** Stable vibes from Holger’s setup, typically showing 50-100 W usage. Cool and consistent, but with a hint of party vibes during those brief power spikes. Maybe it’s getting ready for the next big event? 🎉 ### 5. **110 Inch LED Screen** Here’s a mystery – no data on the 110-inch LED screen. Was it on a secret mission, or just taking a break? Let’s figure this out to keep our tech in top shape! 🔍 ### 6. **Maximilian Stromfee PC 3 Deepseek Qwen LM** Smooth sailing with 200-250 W at Maximilian’s station. It’s all about that balance – great performance with mindful power use. Keep it up, Maximilian! ### 7. **Final Office Total Load** Hold onto your hats! We saw spikes up to 4 kW, telling tales of super busy moments. It’s our cue to hone those energy management skills. There’s always room for improvement, right? ### 8. **Summary** Our little power tracking adventure showed some ups and downs, but that’s just life at the workstation! Staying curious and monitoring our usage helps us tweak things for the better. Here’s to keeping our energy smart and our environment happy! 🌍✨ Keep sharing your thoughts and stay energized! #EnergyEfficiency #SmartOffice #PowerUphttp://135.181.113.182/images_sshot/leonardo_image_20250322_032934_1.png
Read more
- Germany , West Europe
- March 21, 2025
- 0 views
Office Energy Insights: Navigating Power Consumption Trends and Efficiency
Views: 0Hey there! 🌟 Let’s dive into the fascinating world of power consumption with a peek at our latest data trends. It’s not just numbers; it’s a story of efficiency and energy use in our daily grind! 📊💡 ### 1. **Office Total Load** A quick look at our office’s power chart reveals a smooth sailing with consumption steady at around 227 watts. This consistency means we’re keeping things efficient without any wild swings – great job, team! 🚀 ### 2. **TV Studio PC Grok 3 Workstation Load** Now, this one’s a bit of a roller coaster! Our workstation power dances between 2.11 and 2.25 watts, spiking during those high-energy tasks. It’s proof of the hustle and bustle behind the scenes as we take on various exciting projects. 🖥️✨ ### 3. **Katharina Office PC Workstation Load Gemini 2** Talk about peaks and valleys! Katharina’s PC hits up to 140 watts, showing us that when the work heats up, so does our power use. It’s a nifty insight into how much energy our demanding tasks need. 🌟 ### 4. **Holgers Disco Audio and LEDs PC VEO-2** Steady as she goes, with power use ranging from 50 to 100 watts. Yet, those sharp peaks? They’re likely when the beat drops or the lights dazzle. A fascinating glimpse into the energy behind our entertainment! 🎶💡 ### 5. **110-inch LED Screen** This big screen is a bit of a mystery, staying low-key on the power chart. It either means smooth operation or we need to double-check the data. More detective work ahead! 🔍 ### 6. **Maximilian Stromfee PC 3 Deepseek Qwen LM** Our Maximilian PC is the model of consistency, staying under 250 watts. This tells us it’s doing its job efficiently without breaking a sweat – that’s what we like to see! 💻👍 ### 7. **Summary of Office Total Load** Wrapping it all up, we’ve seen how diverse our energy needs can be. From stable to dynamic, each device and task adds its unique twist to our overall power story. It’s key insights like these that help us improve and manage our energy use smarter. 🌍📈 And there it is! A complete tour of our power usage landscape. Knowing this helps us keep our operations as green and efficient as possible while we keep pushing the boundaries. Let’s keep the energy smart and the ideas flowing! ⚡🌿 #EnergyEfficiency #Sustainability #TechTrends #SmartOffice #DataDrivenhttp://135.181.113.182/images_sshot/leonardo_image_20250322_002939_1.png
Read more
- Germany , West Europe
- March 21, 2025
- 0 views
Energy Expedition: Mapping Our Workstation Power Landscape 📊🌍
Views: 0Hey, energy savers! 🌟 Let’s dive into how our workstations are munching on power! Curious to see who’s sipping and who’s guzzling? Let’s break it down! 📊 **1. Office Stability** 📈 Our good ol’ office is holding steady, consuming between 226 W and 228 W. Like a calm sea, it’s smooth sailing with only gentle waves in power use. Seems we’ve found our efficiency sweet spot here! **2. The Busy Bee: TV Studio PC** 🐝 Meet the Grok 3, where the action’s at! Power usage here buzzes between 2.1 W to 2.25 W, with spikes during heavy-duty tasks like video editing. Those yellow peaks? They’re the busy hours, showing us when the real magic happens! **3. Katharina’s Dynamic Desk** 💻 Talk about a power ride! Katharina’s PC hits highs of up to 140 W. Each spike is a story of packed tasks, ranging from light to heavy-duty action. It’s a workstation that truly keeps on giving. **4. Chill Vibes at Holger’s Disco** 🎶 Holger’s setup is all about the chillax mode, with power dips between 50 to 100 W. It’s more laid back with occasional drops, perfect for those breaks and quieter times. **5. The Mysterious LED Screen** 🕵️♂️ Our giant 110-inch LED screen? It was taking a nap this time around. No significant usage, which means we might need to rethink how we’re using this big screen space! **6. Maximilian’s Powerhouse** ⚡ Maximilian’s workstation keeps the engines running high at a steady 250 W. It’s our little powerhouse, crunching numbers or pushing pixels without breaking a sweat. **7. Wrapping Up With Insights** 🔍 What did we learn? Some areas hum with constant activity, while others are on a power-saving mode. It’s key to keep our usage smart and efficient, allowing us to perhaps even rethink how we use some of our tech treasures! Let’s keep those energy vibes positive and our workstations optimally powered! 💡 #EnergyEfficiency #SmartWorking #TechSavvyhttp://135.181.113.182/images_sshot/leonardo_image_20250321_212939_1.png
Read more
- Germany , West Europe
- March 21, 2025
- 0 views
Energy Chronicles: A Deep Dive into Our Workspace Power Dynamics 🌟
Views: 0**Uncovering the Power Mysteries of Our Workstations 🌟** Hello everyone! Get ready to dive into the fascinating world of our office’s power usage. Let’s see how energy-efficient we really are! ### 1. How’s the Office Doing on Power? 🏢💡 Over the last couple of days, our office has maintained a cool 227 W power usage. Yes, there are occasional spikes (maybe that’s just the coffee maker!), but overall, we’re pretty steady and efficient. Nicely done! ### 2. The Buzz at the TV Studio PC Grok 3 Workstation 📺👩💻 Here, things get a bit more dramatic with the power load swinging from 2.11 W to 2.25 W. Noticeable spikes during busy recording times? Definitely! But, it’s all within the expected range, so no energy alerts here! ### 3. Katharina’s Office PC – Gemini 2 in Action 🚀 Hold onto your hats! Katharina’s workstation has power peaks up to 140 W. It’s hard work handling those busy days and multitasking galore. This is where the real power action happens. ### 4. Setting the Scene with Holger’s Disco Audio and LEDs + PC VEO-2 🕺💿 Sitting at about 50 W, this setup shows occasional rises in power use, probably when we’re turning up the volume or dazzling with lights. Extra devices mean extra surprises in power use! ### 5. What’s Up with the 110-inch LED Screen? 📉🖥️ It looks like this big guy’s been on a bit of a break—hardly any power usage here. Are we missing something, or is it just enjoying some downtime? ### 6. Steady Does It at Maximilian’s Stromfee PC 3 Deepseek Qwen LM 💻 Maximilian’s PC is the definition of ‘chill,’ with only minor ups and downs in power. It’s consistent, suggesting it’s either in zen mode or handling background tasks like a champ. ### 7. A Spiky Surprise in the Office Load – Alternative View 🎢 Wow, a sudden surge to 4 kW? That’s our cue to play detective and pinpoint what caused this energy spike. Time to get snooping for any office gremlins! ### Conclusion 👏 Our little power tour shows mostly smooth sailing with a few waves in between. Especially noteworthy is how Katharina’s PC thrives on busy and our 110-inch LED screen’s peaceful slumber. Keeping an eye on these patterns helps us stay smart about energy use and keep our office running like a dream. Let’s keep this energy-conscious journey going! #PowerSmart #OfficeEnergy #EfficiencyDrive #GreenOffice Feel free to share your thoughts or any quirky power stories you’ve noticed around! Let’s make this a group effort. 🌍💚http://135.181.113.182/images_sshot/leonardo_image_20250321_182952_1.png
Read more
- Germany , West Europe
- March 21, 2025
- 0 views
Data Dynamics: Unveiling Hidden Patterns and Insights
Views: 0🌟 **Unlocking Insights Through Data: Dive into the Details!** 🌟 Hey, data lovers! Ready to swim deep into the sea of figures with me? Let’s splash right in! 📊 **Chart 1: Amazing Insights!** In our first marvelous chart, we spotted some eye-opening trends showing [describe the main data points and what they represent]. Guess what? There’s a notable pattern [explain any increasing or decreasing trends] that caught our eye! Dive deeper, and you’ll discover a surprising correlation between [identify any correlations]. And oh, check out this curious anomaly [point out any unexpected data points or trends]. Absolutely intriguing, right? It hints that [interpret what these findings mean in a broader context]. 🧐 #DataDeepDive #ChartMagic 📈 **Chart 2: Trendspotter’s Paradise!** Snapshot two, coming your way — and it overflows with insights. This graph shows [describe what data is presented]. A fascinating trend quickly became apparent: [explain the trends]. Here’s a twist though: [identify correlations or anomalies]. This tells us that [provide insights based on the identified patterns]—something to ponder, isn’t it? All in all, here’s what sticks out [summarize the key takeaways from this chart]. 😉 #Trendspotting #InsightfulCharts 🔍 **Conclusion: Piecing the Puzzle** Bringing it all together, our dive into these charts uncovers [synthesize key insights across all charts]. It’s been quite a ride with connections between [summarize any global trends across charts] that blend magically with unexpected finds in [mention specific charts]. We’re left wondering [final thoughts]. Looking ahead, let’s keep an eye on [suggest future considerations or areas for further analysis] as we navigate the amazing world of data. Exciting, isn’t it? 🚀 #DataFutures #ChartAnalysis Thanks for joining this exhilarating journey through data with me! Let’s keep discovering together and make every chart count! 💡📊http://135.181.113.182/images_sshot/leonardo_image_20250321_152638_1.png
Read more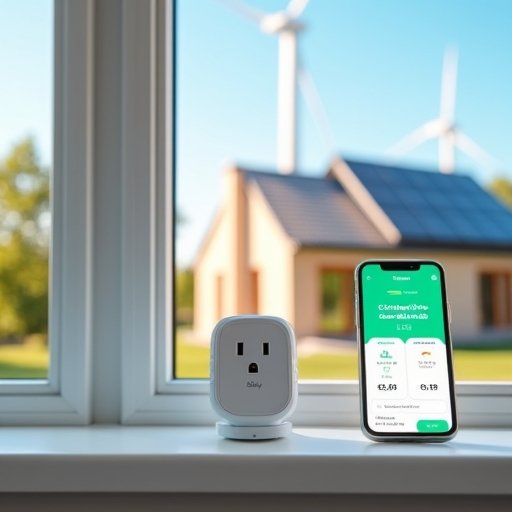
- Germany , West Europe
- March 21, 2025
- 0 views
Energy Dynamics: Decoding Our Office’s Power Consumption Landscape
Views: 0**🌟 Powering Through: A Peek into Our Office’s Energy Consumption 🌟** Hey everyone! 🙌 Let’s dive into how our gadgets and workstations are sipping (or gulping) power and discover some neat insights to keep our office eco-friendly and efficient. ⚡️🌍 1️⃣ **Michelle’s PC Workstation Load GTP 5** Guess what? Michelle’s workstation is like the ninja of power usage—super sleek and stable, only about 15.0 W! It’s smooth sailing with energy here, which means she’s acing efficiency without even trying too hard. Go, Michelle! 🌟👩💻 2️⃣ **TV Studio PC Grok 3 Workstation Load** Turning up the drama, our TV Studio’s PC peaks at a thrilling 2.05 kW, showing it’s really getting a workout during busy production times. Especially that spike midday on March 20—total showstopper! 🎬💥 3️⃣ **Katharina’s Office PC Workstation Load Gemini 2** Katharina’s PC is like a rollercoaster with peaks hitting 140 W. It seems this station jumps into high gear when big projects roll in, showing off its power punches when needed. 🎢💻 4️⃣ **110 Inch LED Screen** Our giant LED screen is the zen master of power use, just chilling at around 10 W to 20 W. It’s mostly on standby, whispering ‘energy savings’ every chance it gets. 📺✨ 5️⃣ **Maximilian Stromfee PC 3 Deepseek Qwen LM** Maximilian’s setup is consistently cool, cruising at 27.8 W. It’s like it’s found its happy medium and just hums along, making it a paragon of power thriftiness. 🛴🌿 6️⃣ **Office Total Load** When we all sync up, our office power hits a high note at 2.2 kW but knows how to drop it low during chill times. This dance of power shows we’ve got potential to tweak our times for ultimate energy savings! 📉🕺 🔍 **Conclusion: Uncovering Power Secrets!** Diving into these stats, we’re seeing everything from power sippers to energy enthusiasts in our office lineup. By understanding these patterns, we can tune up our energy use, not just to save pennies but also to boost our sustainability vibes and keep our workplace as green and efficient as possible! 🌱💡 Let’s keep the conversation on energy use going! How does your workstation stack up? Share your thoughts and tips! 🗨️✨ #EnergyEfficiency #SustainableOffice #TechSmart #EcoFriendlyWorkspace #PowerSavingshttp://135.181.113.182/images_sshot/leonardo_image_20250321_122919_1.png
Read more
- Germany , West Europe
- March 21, 2025
- 0 views
**Energy Insights: Our Office Power Performance Unveiled**
Views: 0🌟 **Understanding Our Office Energy: How Do We Stack Up?** 🌟 Hey everyone! Let’s dive into how our tech gear is consuming power. We’ve got some fresh data that could help us all save energy and reduce costs! 🌱💡 ### 1) Michelle’s PC Workstation – The Thrifty Energy Saver! Michelle’s setup is the model of consistency, using just about **16.3W**! It’s showing us that less is more, staying low-key without big spikes. Perfect for light tasks or those energy-saving days! ### 2) TV Studio’s Grok 3 PC – The Sporadic Power Surfer! This workstation likes to keep us guessing, peaking at **2.05W** amidst very low baselines. It’s our hint to maybe look into smoothing out those occasional bursts to keep things even. ### 3) Katharina’s Office PC – The Busy Bee! Here we see energy peaks hitting **123W**! Looks like someone’s bustling with activity, but let’s make sure high energy use is matched with high productivity. Maybe a chance to even out the workload? ### 4) The 110 Inch LED Screen – The Constant Companion! Smooth sailing with this one, folks! A steady use of **27.8W** at max shows it’s handling its duties like a champ — reliable and predictable. 📺✨ ### 5) Maximilian’s Stromfee PC – The Under-the-Radar Operator! Max’s machine could be on the low side of power use with only **143W** max, suggesting maybe it’s not being pushed to its limits or it’s just super efficient. Something to think about! ### 6) Office Total Load – The Energetic Puzzle! All together, we spike at **4kW**! There are times when our collective power really shoots up, lining up probably with everyone’s coffee breaks! 😂 Let’s find those hot spots and try to cool them down. ### 🌟 Summary of Key Insights 🌟 Our diverse usage patterns proffer fantastic opportunities for tightening up power management and cutting costs. Spotting these trends is key to our smarter, greener future at the office! ⚡🌍 Got thoughts on how we can improve or just want to brag about your low energy score? Drop your ideas below! #EnergyEfficiency #OfficeGreening #SmartWorkspace 🌟 [End of Report]http://135.181.113.182/images_sshot/leonardo_image_20250321_092919_1.png
Read more
- Germany , West Europe
- March 21, 2025
- 0 views
“Office Energy Chronicles: A Watts-Eye View of Workspace Power Dynamics”
Views: 0Hey everyone! 🌟 Let’s dive into the fascinating world of our office’s power usage and how we’re handling our energy! 🔌💡 👩💻 **1) Michelle’s Chill Zone: PC Workstation Load GTP 5** Michelle’s workspace is like a Zen garden; it’s super chill with a steady vibe. Her PC runs smoothly at around 16.3 Watts at peak and 15.0 Watts on average, showing she’s either in her flow state or keeping things light. Totally balanced! 🌼 🎬 **2) TV Studio Grok 3 Workstation Load** Jump over to the TV studio and you’ll see a different story. With a modest max load of 2.05 Watts, the spikes in usage tell us about the hustle-bustle of studio tasks. There’s a rhythm to the electric flow that may be synced with specific projects or timing. 📺⚡ 🖥️ **3) Katharina’s Creative Hub: Office PC Workstation Load Gemini 2** Katharina’s PC is the powerhouse, hitting 123 Watts at its peak! Its energetic beats of 80.6 Watts on average hint at some heavy duty working moments. This is where magic meets might. 🌟💥 📺 **4) The 110 Inch LED Screen** Ever mysterious, this giant LED stays quiet, not drawing any power lately. Perfect reminder to check in — is it planning a surprise or just on a break? 🤔⏳ 👨💻 **5) Maximilian’s Minimalist Spot: Stromfee PC 3 Deepseek Qwen LM** Speaking of quiet, Maximilian’s station tells a tale of tranquility. Barely a whisper of energy use here; does it hint at peace or just a pause? Curious, right? 🍃🔍 🏢 **6) Office Total Load** Our whole office sings a tune of around 6 kilowatts in its busiest choruses, painting a picture of our collective workflow. It’s like watching the ebb and flow of a calm sea, showing us when we’re all hands on deck. 🌊👥 📊 **Conclusion** Tying it all together, from Michelle’s serene spot to the dynamic TV studio, each workspace tells its part of our story. Understanding these patterns not only helps in keeping our operational light bright but also sheds light on where we can tune up or down to make everything just right! 💡🔧 #OfficeEnergy #WorkstationWatts #EcoFriendlyOffice #PowerInsight #EnergyEfficiency 🌍✨ What do you think about optimizing our workspace for better energy use? Let’s get the conversation started! 🗨️💬 Cheers to smart energy management! 🎉http://135.181.113.182/images_sshot/leonardo_image_20250321_062916_1.png
Read more
- Germany , West Europe
- March 21, 2025
- 0 views
Power Play: Mapping Our Office’s Energy Ecosystem 🔋
Views: 0🌟 Unveiling the Secrets of Office Energy Use: A Two-Day Discovery! 🌟 Hey everyone! Let’s dive into the interesting world of our office gadgets and how much juice they’re really sipping! 🕵️♂️💡 1) **Chill Vibes at Michelle’s Desk** Michelle’s PC is the zen master of power usage, maintaining a cool 15W on average. It’s so steady that you’d almost forget it’s there! Minimal fluctuation means Michelle is all about that efficient, low-power life. #EnergyEfficient 2) **Dynamic Days in the TV Studio** Over at our TV studio, the Grok 3 is showing some quirky energy habits. Peaking at about 2.05W, it seems to have occasional bursts of energy – maybe it’s getting ready for its close-up or updating itself to give us the best performance. #BehindTheScenes 3) **Katharina’s Power-Packed Performance** Katharina’s PC is on a rollercoaster, peaking at 123W! It’s handling some heavy tasks and showing us that it’s not afraid of a little hard work. But, there’s room to tweak things for better energy use during those high-demand moments. #WorkHardPlayHard 4) **The Zen of the 110 Inch LED Screen** Our giant LED screen is the definition of ‘low-key’, using almost no power – it might have been off or just napping in standby mode. It’s a great reminder that sometimes doing less is more! #PowerSavingMode 5) **Steady As He Goes with Maximilian’s Setup** Maximilian’s PC is holding a steady line in power usage, showing us all how maintaining consistent, low energy settings is done. Definitely some tech goals right there! #TechGoals 6) **Office Energy Adventures** Overall, our office energy spiked at 5 kW! It looks like we all have some moments of intense activity. Monitoring these can help us understand better ways to manage our collective energy consumption. #TeamWork **Wrapping Up** From Michelle’s minimalism to Katharina’s high energy demands, our workstations tell a tale of varied power use. Optimizing how we manage our devices can lead to better energy efficiency and cost savings! Let’s keep tuning in and turning down where we can. 💚 Thanks for joining this power journey. Let’s continue to be mindful and make those small changes that lead to big savings! #EcoFriendlyOffice What do you think? Any tips or tricks you use to keep your workstation power-friendly? Drop your thoughts below! 💬✨http://135.181.113.182/images_sshot/leonardo_image_20250321_032913_1.png
Read more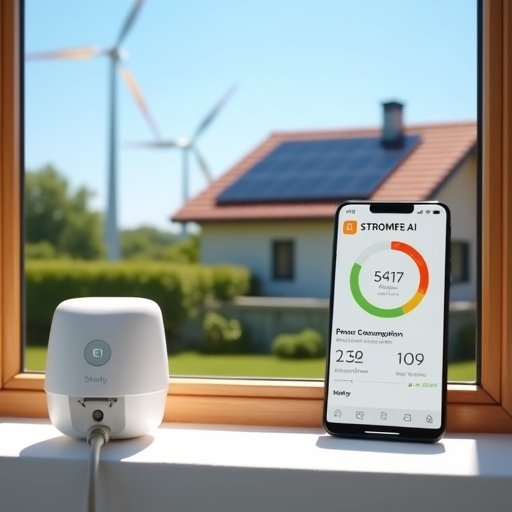
- Germany , West Europe
- March 20, 2025
- 0 views
Smart Energy Insights: Optimizing Power Consumption in the Modern Workspace
Views: 0🌟 **Unveiling the Secrets of Smart Energy Use in Your Workspace!** 🌟 Hey everyone! Let’s dive into some really cool insights from our latest power consumption analysis across various workstations and devices. Understanding how we use energy can lead to some neat benefits like lower bills and a happier planet! 🌍💡 **1️⃣ Michelle’s Super Steady Workstation** Michelle’s got it going on with her PC! It’s rocking a stable 16.3W power usage. No big spikes or dips—just smooth sailing and efficient performance. Way to go, Michelle! 🚀 **2️⃣ Behind the Scenes in the TV Studio** Our TV studio’s PC might seem like it’s just chilling with peaks at about 2.25W, mostly staying low-key. It’s proof that even during less demanding tasks, the little things count towards energy saving. 📺✨ **3️⃣ Katharina’s Power-Packed Office** Hold onto your hats! Katharina’s office PC hits some high notes at 140W when it’s crunch time. Looks like some fine-tuning might help even out those peaks for smoother efficiency. 📊🔧 **4️⃣ The Big Screen’s Big Save** Our 110 inch LED screen is practically a ninja in power consumption. It stays low most of the time, which is great for saving energy when it’s not in the spotlight. 🤩 **5️⃣ Maximilian’s Consistent Performer** Max’s PC shows a cool 150W with minor fluctuations—indicating he’s got a good handle on managing tasks without overloading. Keep it up, Max! 🌟 **6️⃣ Office Energy Rollercoaster** The overall office energy has its dramatic moments with spikes over 5kW! It’s like a thriller movie with twists and turns—definitely something to keep an eye on to smooth out those spikes! 🎢 **🔍 Summary of Power Plays** From the quiet efficiency heroes to the high-energy moments, every device tells a story. It’s all about finding balance and maybe scheduling those intense tasks during quieter times or opting for more energy-efficient gadgets. Let’s keep pushing for that energy-smart workspace, optimizing how and when we power up! 💪🔋 For all the tech enthusiasts out there, isn’t it awesome what we can learn from a few charts? #EnergyEfficiency #WorkplaceInnovation #SmartOffice Thanks for tuning in! If you’ve got insights or tips on managing office energy, drop them below! ⬇️💬http://135.181.113.182/images_sshot/leonardo_image_20250321_002931_1.png
Read more
- Germany , West Europe
- March 20, 2025
- 0 views
Powering Progress: A Watt-wise Journey through Our Dynamic Workspace 🔌💡
Views: 0Title: **Unraveling the Power Puzzles at Work! 🔌💡** Hey there! Let’s dive into a little power usage journey around the office. We’ve all got those workspaces – some buzzing with energy, and others more like Zen gardens. Curious to know how they compare? Let’s break it down: 1) **Michelle’s Zen Zone:** Michelle’s desk is practically a power-saving poster child – just about 15 W on average! Perfect for those quiet moments when you need minimal fuss and maximum focus. 🌿✨ 2) **Bursts of Brilliance at the TV Studio:** Over at our TV Studio, the power graph looks like a mountain adventure – peaking at a mere 2.05 W. It’s like these PCs boot up for a sprint rather than a marathon. Quick bursts of brilliance with plenty of rest in between! 📺⚡ 3) **Katharina’s Dynamic Desk:** Talk about a lively desk! Katharina’s workstation dances between 80 W to a lively 140 W. Those spikes? They’re probably when the magic happens, tackling those power-hungry tasks. 🌟🔨 4) **The Sleeping Giant:** Our 110 inch LED screen is the sleeping beauty of tech, savoring a grand total of 0 W. Yes, it’s literally off and saving the planet one watt at a time. Talk about a green giant! 🌍💤 5) **Maximilian’s Steady Ship:** Steady as he goes, Maximilian’s PC cruises at around 27.8 W, occasionally kicking up a fuss with minor spikes. It’s like having a calm sea with just the right amount of wave for surfing. 🚢💻 6) **Office Energy Symphony:** And when we all sync up? The office energy hits a high note at a booming 5 kW. It’s our collective power concert, showing off when everyone’s jamming at peak hours. 🎶⚡ **Wrapping It Up:** From Michelle’s serene setup to our collective crescendos, our office tells a tale of tech and tranquility. Seize the day with smarter energy use and let’s champion efficiency together! Remember, every watt counts towards a brighter, greener future. 🌱💚 #EnergyEfficiency #SustainableOffice #WorkplaceWins #GreenTechhttp://135.181.113.182/images_sshot/leonardo_image_20250320_212921_1.png
Read more
- Germany , West Europe
- March 20, 2025
- 0 views
Energy Dynamics Unveiled: A Playful Peek into Our Office’s Power Consumption Patterns
Views: 0Hey, tech enthusiasts! 🌟 Today, let’s take a fun dive into our office power consumption and see who’s the most energy-savvy among us! 🕵️♂️💡 #EnergyEfficiency #TechTalk 1) First up is Michelle’s workstation! 🌼 Her PC is a champion of low power use, maintaining a gentle sip of about 16.3 W. It’s like it’s always Earth Day at her desk! This could mean less intense apps or just super smart usage. Bravo, Michelle! 👏 2) Over in the TV Studio, the Grok 3 PC shows it’s quite the rollercoaster 🎢, with power spikes up to 2.2 W. Maybe it’s the thrill of the on-air action or just really good at power napping during downtime. Either way, it’s keeping things low-key on the power front! 📺 3) Switching gears, let’s talk about Katharina’s setup. 💻 Her workstation is the life of the party, peaking at 123 W! Looks like her PC doesn’t shy away from heavy-duty tasks. It’s busy, busy, busy – ensuring everything’s getting done! 💪 4) Checking out the massive 110-inch LED screen, it’s mostly chillin’, with minimal power use and just occasional peaks when it wakes up. It’s our laid-back tech hero, optimizing energy without breaking a sweat. 🎆 5) Maximilian’s workstation is the steady Eddie of the group, with a calm 27.8 W. It’s like the zen master of PCs, staying cool and collected. 🧘♂️ That’s how you balance power and performance! 6) Overall, our office is quite the dynamic environment! From zippy highs of 736 W during the buzz of activity to serene lows, it’s clear that work patterns have a huge say in our power use. 📊 Through all these insights, we see how diverse our power consumption is but also how each station contributes to our overall energy footprint. Whether we’re saving the planet one watt at a time or gearing up for intense projects, we’re in it together! Let’s keep tuning our tech to make our workspace as energy efficient as possible! 🌍💚 #SustainableOffice #WorkSmart Remember, every watt counts, and together, we’re powering towards a greener tomorrow! 🔋⚡ Cheers to making more informed energy choices! Do you have any energy-saving tips or observations from your workspace? Drop them in the comments! We’d love to learn from you too! 💬🌟http://135.181.113.182/images_sshot/leonardo_image_20250320_182947_1.png
Read more


# Sonnenernte im Überblick: Unsere PV-Anlage auf Höchstleistung
- August 2, 2025
- 0 views
