Temperature Tango: Decoding Energy Efficiency and Cooling System Performance 🌡️⚡
Hey, Instagram fam! 🌞❄️ Let’s dive into some cool data trends that we’ve been tracking!
Hey, Instagram fam! 🌞❄️ Let’s dive into some cool data trends that we’ve been tracking! Swipe through as we explore the intriguing dance between temperatures and cooling system performance. 📊✨
1️⃣ Temperature Check! Over the last few weeks, we’ve seen temps swing from chilly -5°C to a comfy 15°C. 👀 As we waved goodbye to winter and welcomed spring, temps started to climb, hitting peak vibes near 15°C around January 27! 🌷 This rollercoaster is a perfect reminder to tweak our heating settings to stay cozy without overdoing it!
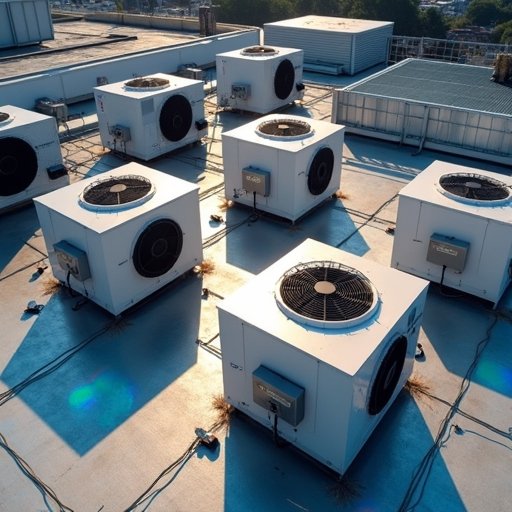
2️⃣ Cooling System Scoop! Alongside rising temps, our cooling systems had to up their game. 🌬️💡 Power usage spiked, especially in late January, showing how our systems work harder to keep us chill. The peaks and troughs in our chart around a 12.3 kW average, with a max of 31.7 kW, tell us when we were maxing out, giving us clues on how to be more energy-wise!
3️⃣ Connecting Dots! As the mercury rose, so did our cooling demands—totally expected, right? But here’s the twist: there were times our energy use shot up even without the heat bump. 🤔 This could mean some tweaks are needed to avoid energy guzzling and keep things smooth and efficient.
4️⃣ Wrapping Up! It’s all about staying ahead of the curve! By keeping an eye on these patterns, we can optimize our energy use, save some coin, and keep our systems in top shape. 🚀 Remember, every bit of efficiency helps us do better by our planet too! 🌍💚
We’re all about making sense of the complex stuff, making it easy and actionable for you! Keep following for more insights wrapped in fun! 😄 #TemperatureTrends #EnergyEfficiency #Sustainability #SmartLiving #DataLovers #CoolingSystems #ClimateAction
Let’s keep the conversation going! How do you manage your energy use at home? Drop your tips or questions below! ⬇️✨