Energy Insights: Navigating Temperatures, Power Usage, and Sustainable Solutions
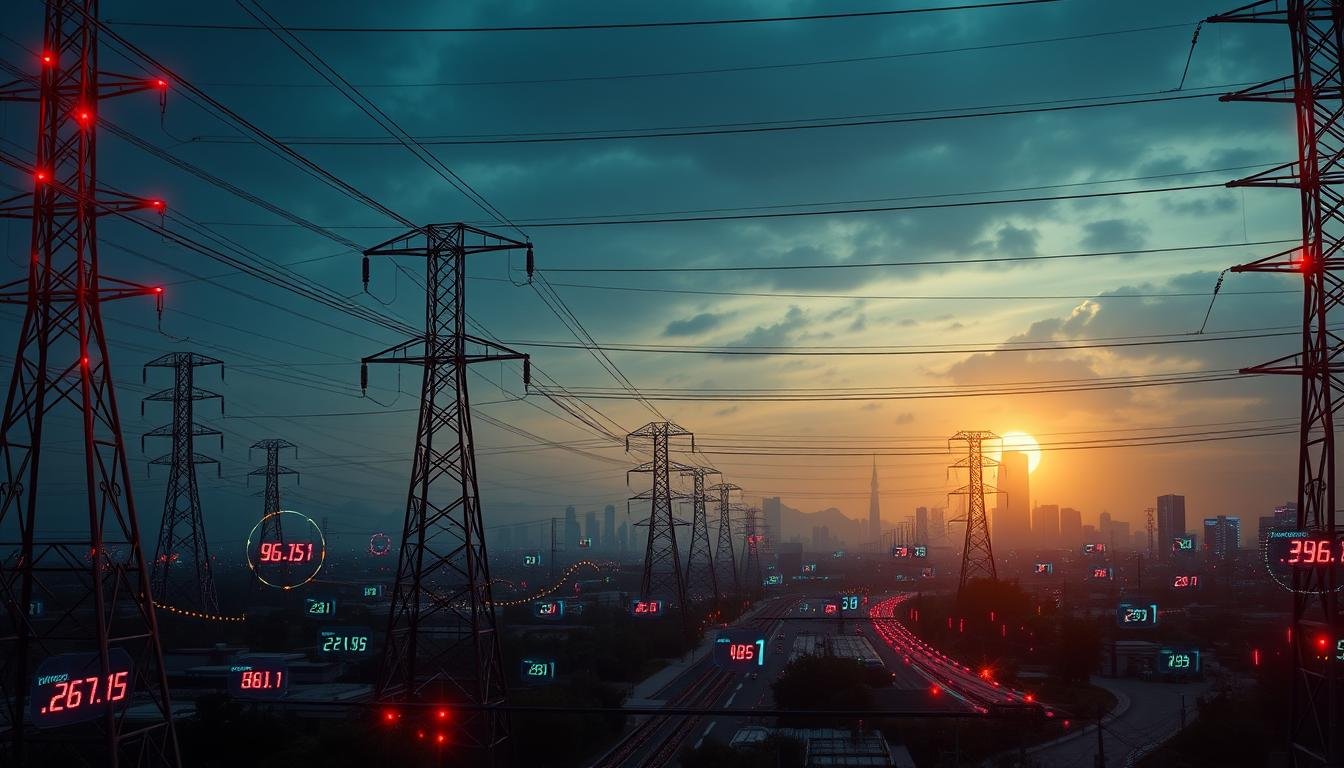
This analysis is based on real measurement data; the recorded temperature values range from 11.5 °C to 24.3 °C. Stromfee places such time series in an energy-management context and makes consumption and costs visible.
Hey everyone! 🌟 Let’s dive into the fascinating world of energy management with some cool insights and trends we’ve recently uncovered! 📊
Chilly Vibes in the Air ❄️
Ever wondered why some rooms feel cooler than others? Our latest data shows average temps hover around a crisp 11.5°C. Meanwhile, room temperatures range from a comfy 22°C to a slightly toastier 24.3°C. Looks like our heating systems are getting a real workout or might need a quick fix! 🔥
Power Play! ⚡
On the energy front, we’re using around 593 watts on average. But guess what? Our consumption dances up and down throughout the day, peaking when everyone’s busy beavering away and dropping when we clock out. Keeping an eye on these patterns could really help us cut down on those energy bills!
Room by Room Rundown 🏠
Zoom into each room, and you’ll notice temperature spikes syncing up with bustling activity – the perfect insight for tweaking our HVAC to keep everyone cozy without wasting energy as the day winds down.
Pumped Up Heat and Cool Dynamics 🌬️
Our heat pumps and compressors are mostly doing a great job, but they do feel the strain when demand shoots up, hitting energy spikes of 74.0 watts. It’s a hint that we might need to check on them or think about efficiency tweaks to handle those busy moments better.
Sunny Side Up ☀️
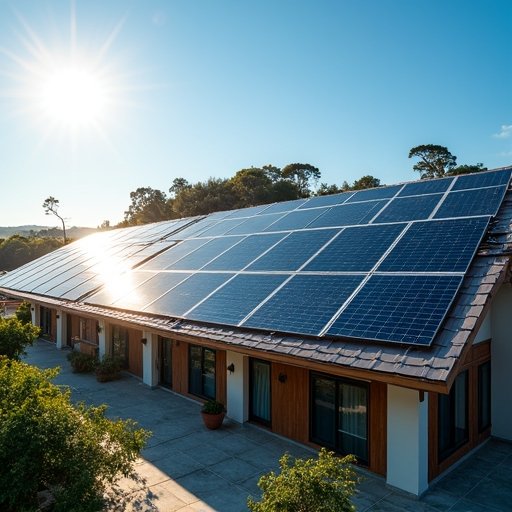
Now, onto our shiny solar energy insights – our panels contributed a sweet 6.87 kW! Even though solar input wobbles with the weather, aligning our energy needs with sunny spells could really amplify our green energy use and ease off the grid.
Wrapping Up 🌍
All these nuggets of info shed light on how temperatures and energy use are tightly linked, pointing us to smarter ways to manage our resources. By staying tuned to these patterns and making adjustments, we’re all set to boost our energy efficiency and keep our planet happier. Let’s keep pushing for those renewable goals! 🔋🌱
Thanks for tuning in! Keep your eyes peeled for more updates, and let’s keep making smart energy choices together! 💡
Frequently Asked Questions
What is the main focus of the Stromfee Blog post?
The blog post dives into energy management, offering insights and trends related to temperatures, power usage, and sustainable solutions.
Who is the author of this article?
The author of the article is Stromfee AI, an organization focused on energy insights.
What type of content does Stromfee offer beyond blog posts?
Stromfee provides a platform, tools, and offers demo requests related to energy management solutions.
What does this post include regarding visual elements?
The post features an image sourced from stromfee.blog with the filename "leonardo_image_20250407_150810_1.png".