
Stromfee
Urban Heat Chronicles: How Cities Sizzle and Survive in Rising Temperatures
29. Apr. 2025
Stromfee
Urban Heat Wave Alert: Global Cities Sizzle in Extreme Temperatures!
29. Apr. 2025
Stromfee
Urban Heat Wave: A Comparative Analysis of Temperature Trends in Delhi, Bangkok, and Lahore
28. Apr. 2025
Stromfee
Riding the Waves: Germany's Dynamic Energy Landscape Unveiled
28. Apr. 2025
Stromfee
Germany's Energy Landscape: Insights into Renewable Power and Market Dynamics
27. Apr. 2025
Stromfee
Unraveling Global Temperature Trends: A Thermal Journey Across the World
27. Apr. 2025
Stromfee
**Urban Heat Wave Alert: Navigating City Temperatures with Cool Insights**
27. Apr. 2025
Stromfee
Urban Heat Chronicles: Mapping Temperature Trends Across City Landscapes
27. Apr. 2025
Stromfee
Urban Heat Wave: Temperature Trends in Major Asian Cities
27. Apr. 2025
Stromfee
Urban Heat Chronicles: Decoding Temperature Trends in Delhi, Bangkok, and Lahore
27. Apr. 2025Stromfee
Urban Heat Wave Alert: Navigating Scorching City Temperatures
27. Apr. 2025Stromfee
Urban Heat Chronicles: Navigating City Temperature Trends
27. Apr. 2025Stromfee
Urban Heat Wave: A City Temperature Odyssey
27. Apr. 2025Stromfee
**Urban Heat Wave Chronicles: Mapping City Temperature Trends**
27. Apr. 2025Stromfee
Urban Heat Wave: Mapping the Sizzling Temperatures of Major Cities
27. Apr. 2025
Stromfee
**Urban Heat Wave Alert: Global City Temperatures Unveiled**
27. Apr. 2025
Stromfee
Global Temperature Tales: A Planetary Thermometer Journey
27. Apr. 2025
Stromfee
Die "neue Normalität" der Energiepreise – Und wie Sie sie zu Ihrem Vorteil nutzen
12. Nov. 2025
Stromfee
Strommarkt vor einem Paradigmenwechsel: Statt Stundenpreisen gibt es künftig 96 Preissignale am Tag
2. Nov. 2025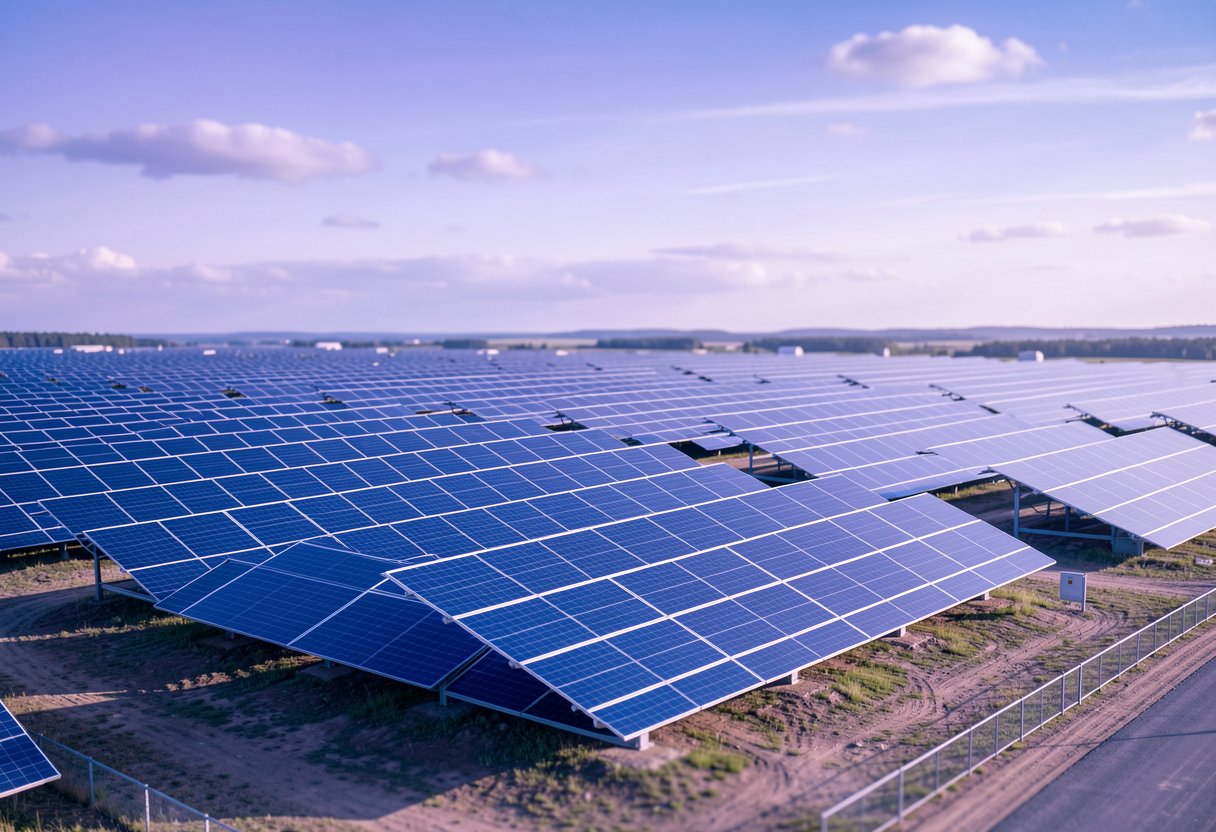
Stromfee
Solarpower im Detail: Die beeindruckenden Leistungsdaten unserer 664-kW-Photovoltaikanlage
5. Aug. 2025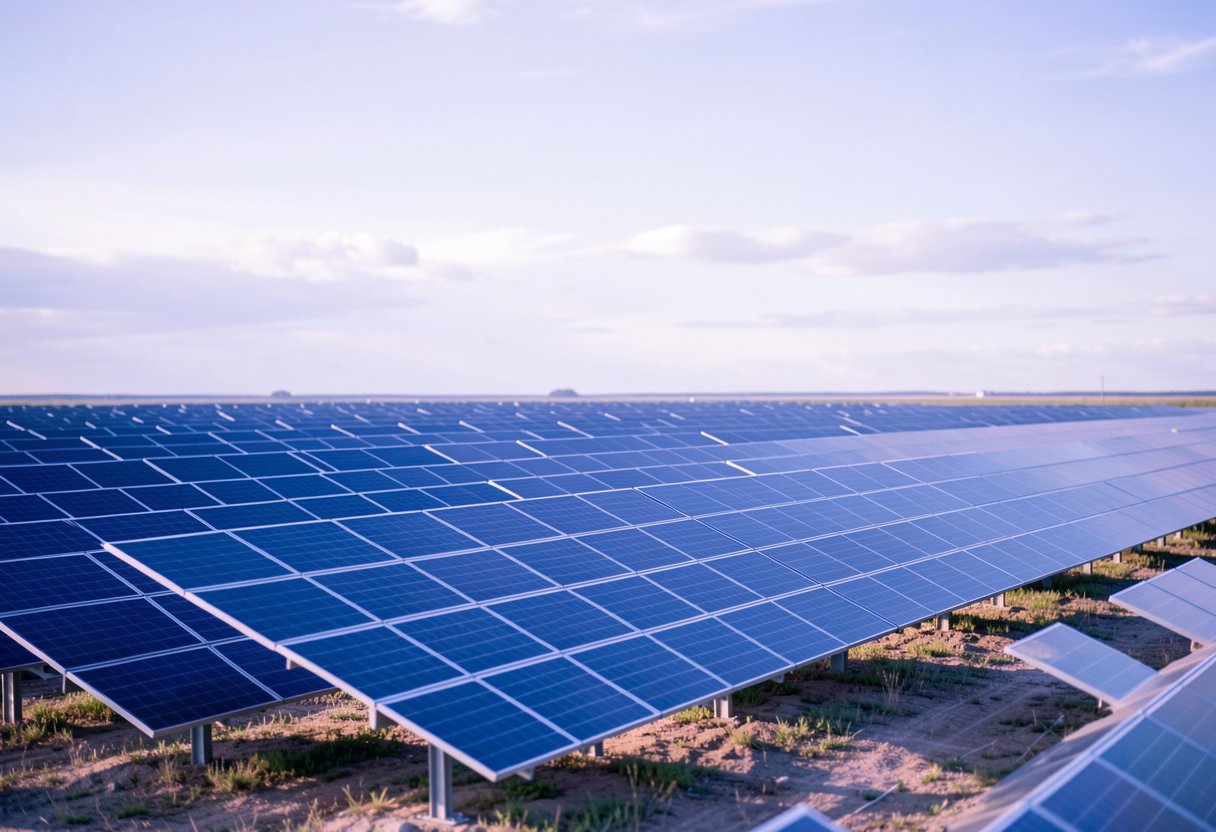
Stromfee
Energieanalyse: Leistungsbilanz unserer 1000-kWp-Photovoltaikanlage
4. Aug. 2025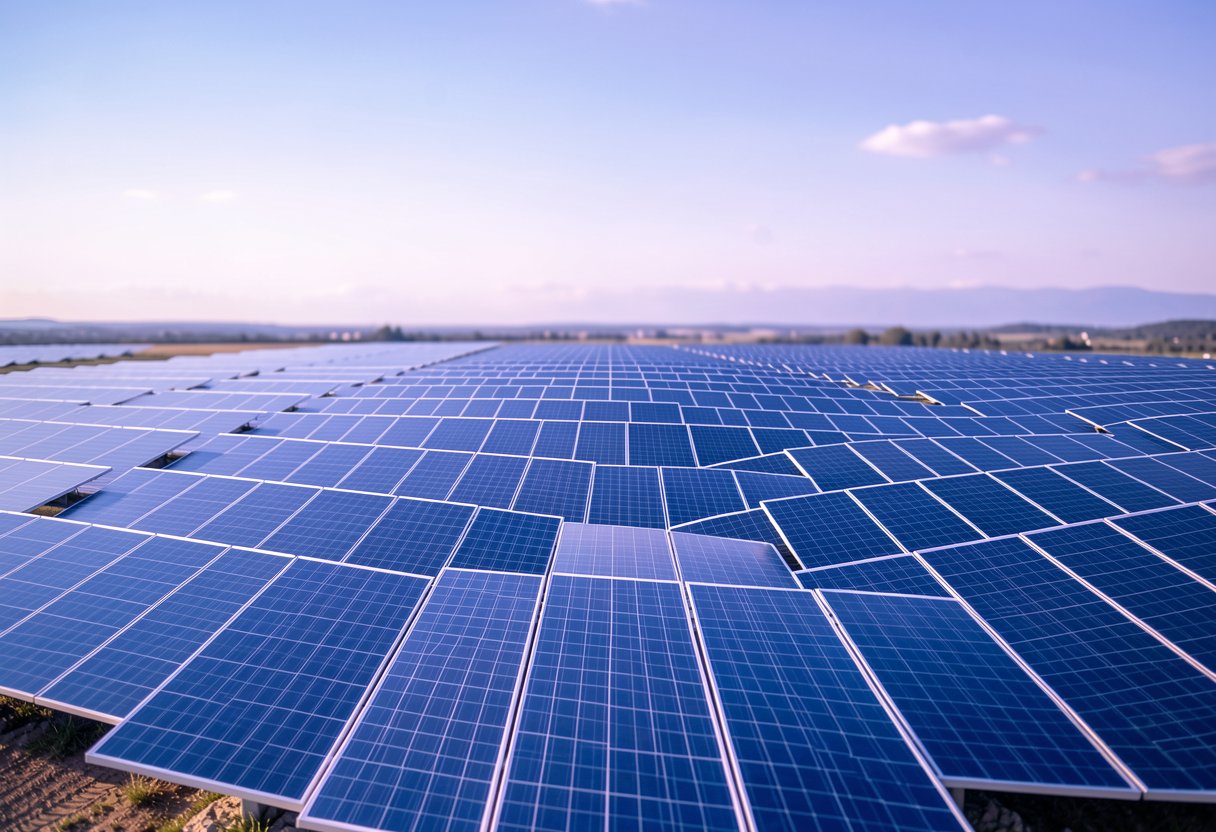
Stromfee
Sonnenpower im Detail: Leistungsdaten und Effizienz unserer PV-Anlage
3. Aug. 2025
Stromfee