Biogas Plant Energy Chronicles: A Deep Dive into Performance Dynamics
The basis is measured power time series of a biogas/CHP plant — from fermenter and mixer load to electrical output. Such operating data reveals the plant's utilisation, stability and room for optimisation.
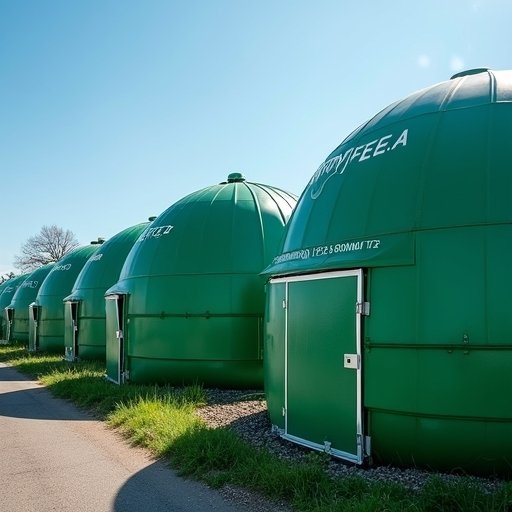
🌱🔍 Let’s dive into the fascinating world of biogas plants, energy lovers! Ever wonder how these eco-champs perform? We’ve got the scoop straight from their heartbeat—yes, the time series data! 📊✨
1️⃣ Power Play
Guess what? Our biogas buddy munches on energy between 30.6 kW to a hefty 78.4 kW to keep the gas flowing—talk about a healthy appetite! These fluctuations? They’re like the plant’s mood swings, indicating how busy it gets. 🌪️🍃
2️⃣ Stir & Pump It Up
In the mixing zone, our trusty stirrer (Rührwerk) keeps things smooth with a steady vibe of around 20-22 kW. Now, the pumps? They’re a tad moody, running from almost zero to 3.28 kW. Time to keep an eye on them! 💪🔄
3️⃣ Solid Dosing Stability
Loading solids into the fermenter is like the plant’s daily workout, and it’s keeping it pretty steady. Consistency is key to keep the bio-energy party going! 🎉💚
4️⃣ Fermenter Fun
Our fermenter trio is doing a fantastic job, each rocking their tasks with minimal energy spikes. A smooth operation means more green power—gotta love that! 🌟🌿
5️⃣ After the Party
Post-fermentation processing? It’s on a roll too, with power munching in a good range. Staying vigilant here means squeezing out every bit of energy possible. 🥳⚡
6️⃣ Energy Quirks
And, oh! We’ve spotted some weird energy dips and flips in the storage area. Looks like a cue for a little tune-up to keep things accurate and efficient. 🔧📉
🌍 Summing It Up
Every watt tells a story, and with consistent monitoring and some smart tweaks, there’s a lot of potential to boost productivity and keep things sustainably smooth at the biogas plant. 🔄💡
Let’s keep the energy clean and green, team! 💚🌏