Stromfee
The Nvidia H100 GPUs: Powering the Future with a Punch
15. Feb. 2025
Stromfee
Temperature and Cooling Dynamics: A Comprehensive Trend Analysis
14. Feb. 2025
Stromfee
Temperature and Cooling Load Trend Analysis: Insights from Seasonal Variations and Compressor Performance
14. Feb. 2025
Stromfee
Decoding Energy Dynamics: Stromfee AI's Electrifying Performance Insights
14. Feb. 2025
Stromfee
Energy Dynamics Unveiled: Tracking Temperature's Impact on Cooling Loads and Efficiency
14. Feb. 2025
Stromfee
Temperature and Energy Dynamics: Unveiling Seasonal Patterns and Consumption Insights
14. Feb. 2025
Stromfee
Decoding Energy Dynamics: Insights from the Stromfee AI Report
14. Feb. 2025
Stromfee
Temperature Trends: Unveiling the Cool Science of Compressor Energy Dynamics
14. Feb. 2025
Stromfee
Energy Dynamics: How Temperature Swings Impact Home Power Consumption
14. Feb. 2025
Stromfee
Stromfee AI Report: Unveiling Energy Performance and Price Dynamics
14. Feb. 2025
Stromfee
Energy Insights Unveiled: A Stromfee AI Report on Grid Performance and Power Dynamics
14. Feb. 2025
Stromfee
Stromfee AI Energy Insights: Navigating the Electrifying Landscape of Power and Performance
14. Feb. 2025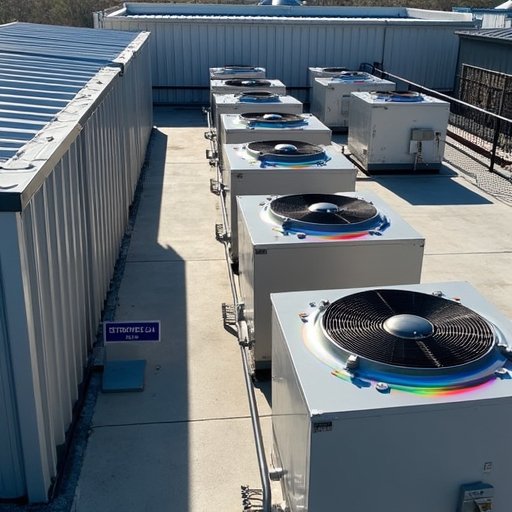
Stromfee
Tracking Temperature Trends: Insights into Energy Consumption and Climate Dynamics
14. Feb. 2025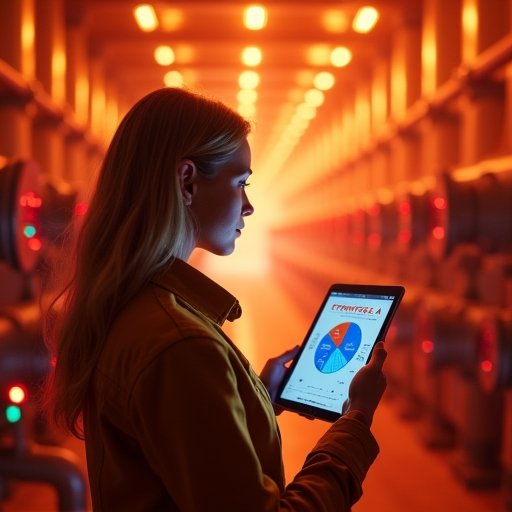
Stromfee
"Stromfee AI Report: Unveiling Energy Efficiency Insights and Power Performance Trends"
14. Feb. 2025
Stromfee
Energiepreise im Fokus: Eine Dynamische Analyse von Strom, Motoren und Effizienz
14. Feb. 2025
Stromfee
Energieanalyse entschlüsselt: Intelligente Einblicke in Strompreise, Motorleistung und Effizienz
14. Feb. 2025
Stromfee
Die "neue Normalität" der Energiepreise – Und wie Sie sie zu Ihrem Vorteil nutzen
12. Nov. 2025
Stromfee
Strommarkt vor einem Paradigmenwechsel: Statt Stundenpreisen gibt es künftig 96 Preissignale am Tag
2. Nov. 2025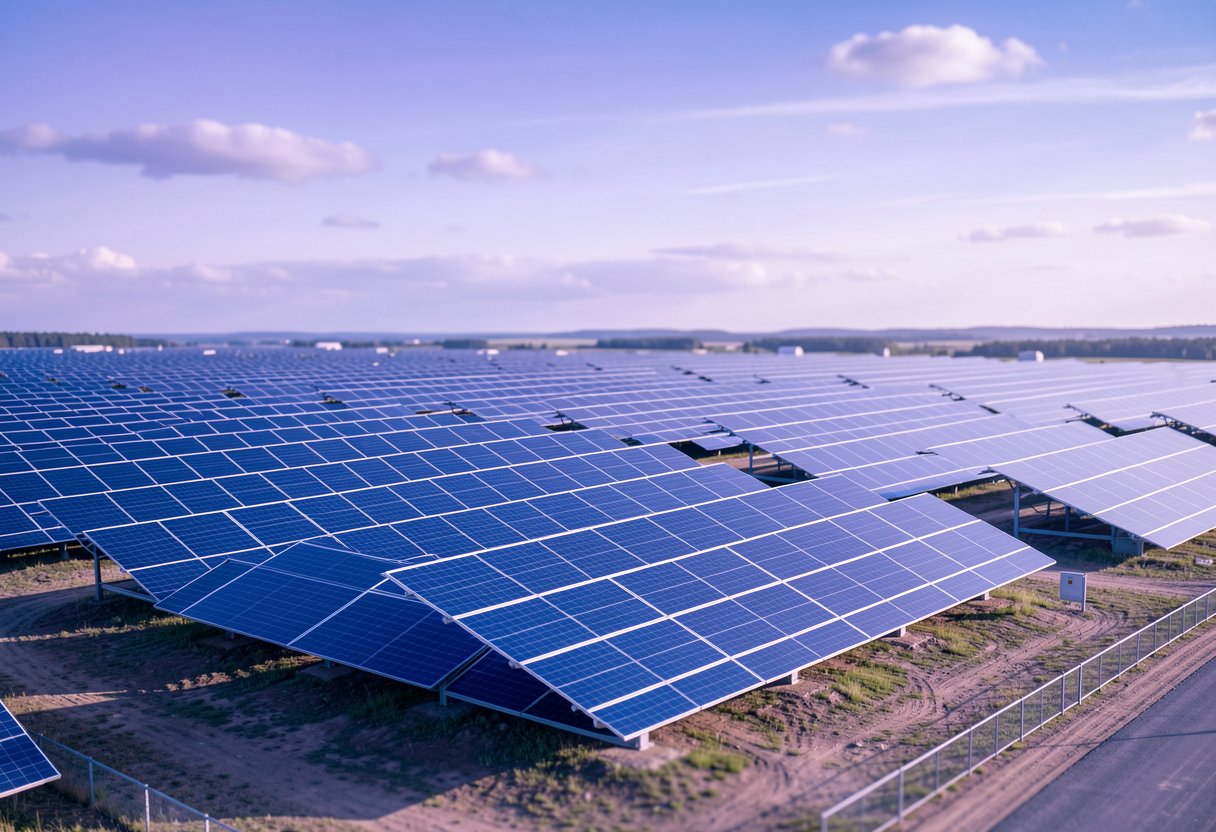
Stromfee
Solarpower im Detail: Die beeindruckenden Leistungsdaten unserer 664-kW-Photovoltaikanlage
5. Aug. 2025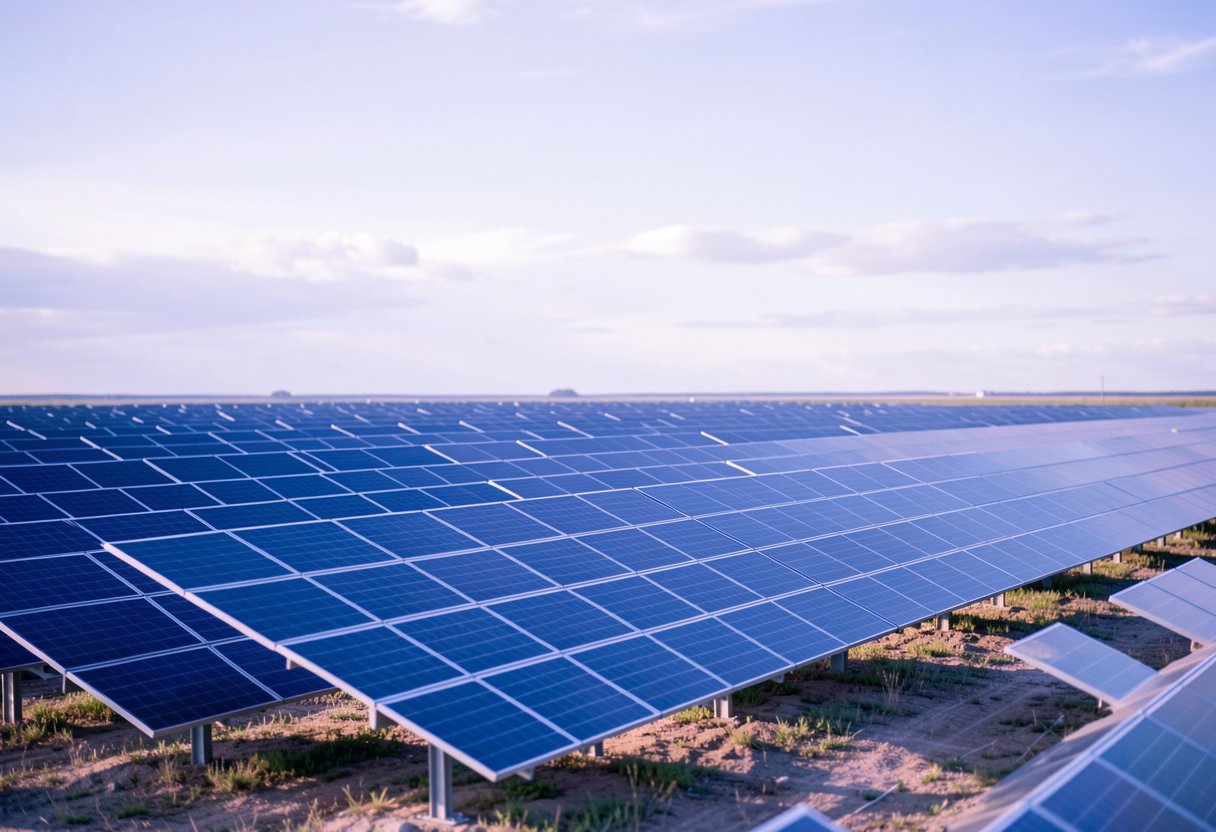
Stromfee
Energieanalyse: Leistungsbilanz unserer 1000-kWp-Photovoltaikanlage
4. Aug. 2025
Stromfee
Sonnenpower im Detail: Leistungsdaten und Effizienz unserer PV-Anlage
3. Aug. 2025
Stromfee